Navigating Rates
US elections monitor: looking back to look forward

In the first of a two-part series, we explore the potential impact on markets of the US elections in November. Our starting point: what does history tell us about how markets perform under Republican versus Democratic presidents?
Key takeaways
- The countdown to the US elections in November is well underway and the market response to the outcome will be crucial.
- Our analysis shows US equities tend to shine under Democratic presidents, but US Treasuries do best during Republican terms.
- We found that both equities and bonds perform better when the governing party lacks a majority in Congress.
- We think more resilient economic growth and higher inflation under Democratic presidents may, in part, explain the historical pattern.
Our analysis explores how the main asset classes – US equities and US Treasuries – performed under past Democratic and Republican presidents since the end of the Second World War in 1945.
This analysis is based on the annualised returns of US equities, using the S&P 500 as the proxy, and US Treasuries (with a 10-year maturity) spanning 14 presidents. We chose November in each election year (rather than the presidential inauguration the following January) as the starting point for our analysis as markets are generally aware of the results by then.
Finding 1: Equities tend to shine under Democratic presidents
Our analysis shows US equities do better when Democratic presidents are in power. Equities delivered a return of 13.8% in nominal terms (without factoring in inflation) vs 8.9% under Republican presidents. When factoring in inflation, real returns were 9.7% vs 5.1%.
But it’s more nuanced than which party wins the presidency. In the US system, one party may gain control of the White House, while another may claim a majority in one or both houses of Congress. A divided government can limit the president’s policy ambitions – and affect equity returns:
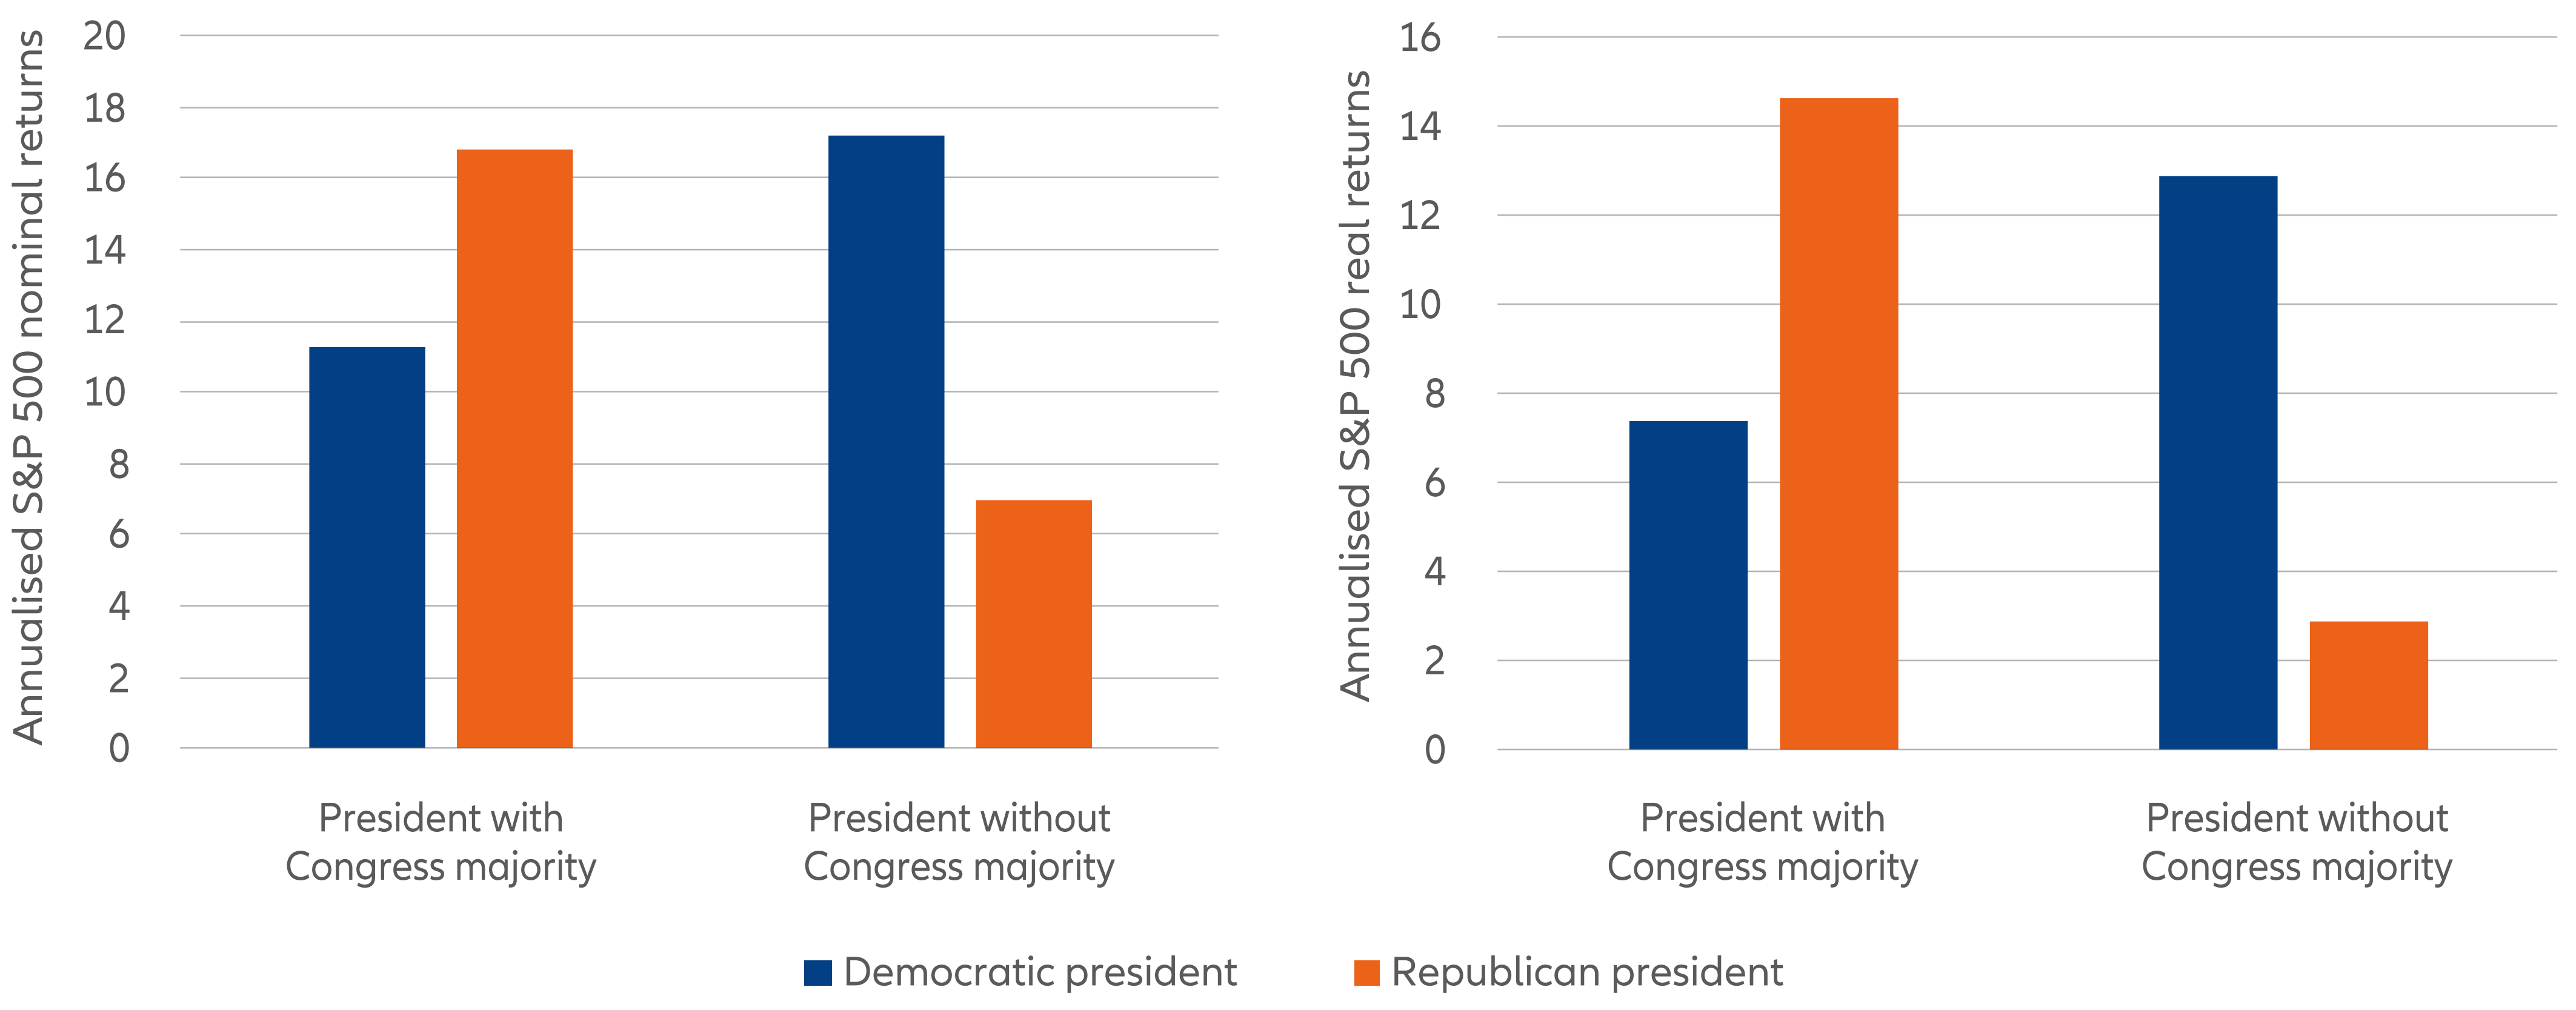
- The S&P 500 performed best under Democratic presidents without a majority in Congress, delivering a 17.2% return in nominal terms (see Exhibit 1).
- Returns were almost as good for a Republican president with a Republican majority in Congress (16.8%).
- Equity returns were 11.3% under Democratic presidents with a majority in Congress.
- Lowest equity returns by far came under Republican presidents without a majority in Congress (7%).
Results in real terms followed a similar pattern, except that the best returns came under a Republican president with a Congress majority (14.6% vs 12.9% under Democratic presidents with no Congress majority).
Exhibit 1: In nominal terms, US equities perform best under Democratic presidents without a majority in Congress. In real terms, the best returns are under Republican presidents with a Congress majority.

Source: AllianzGI, GFD, data as at December 2023. Note: calculations based on monthly data; respective periods always starting in November of an election year.
Finding 2: Bonds generally do best under Republican presidents
Turning to fixed income, 10-year US Treasuries perform better under Republican than Democratic presidents: 6.8% in nominal terms vs 3.2%. In real terms, the difference was even starker, with Treasuries delivering 3% during Republican administrations compared to a negative -0.5% performance during the terms of their Democrat counterparts.
Assessing performance according to presidencies with and without a majority in Congress showed:
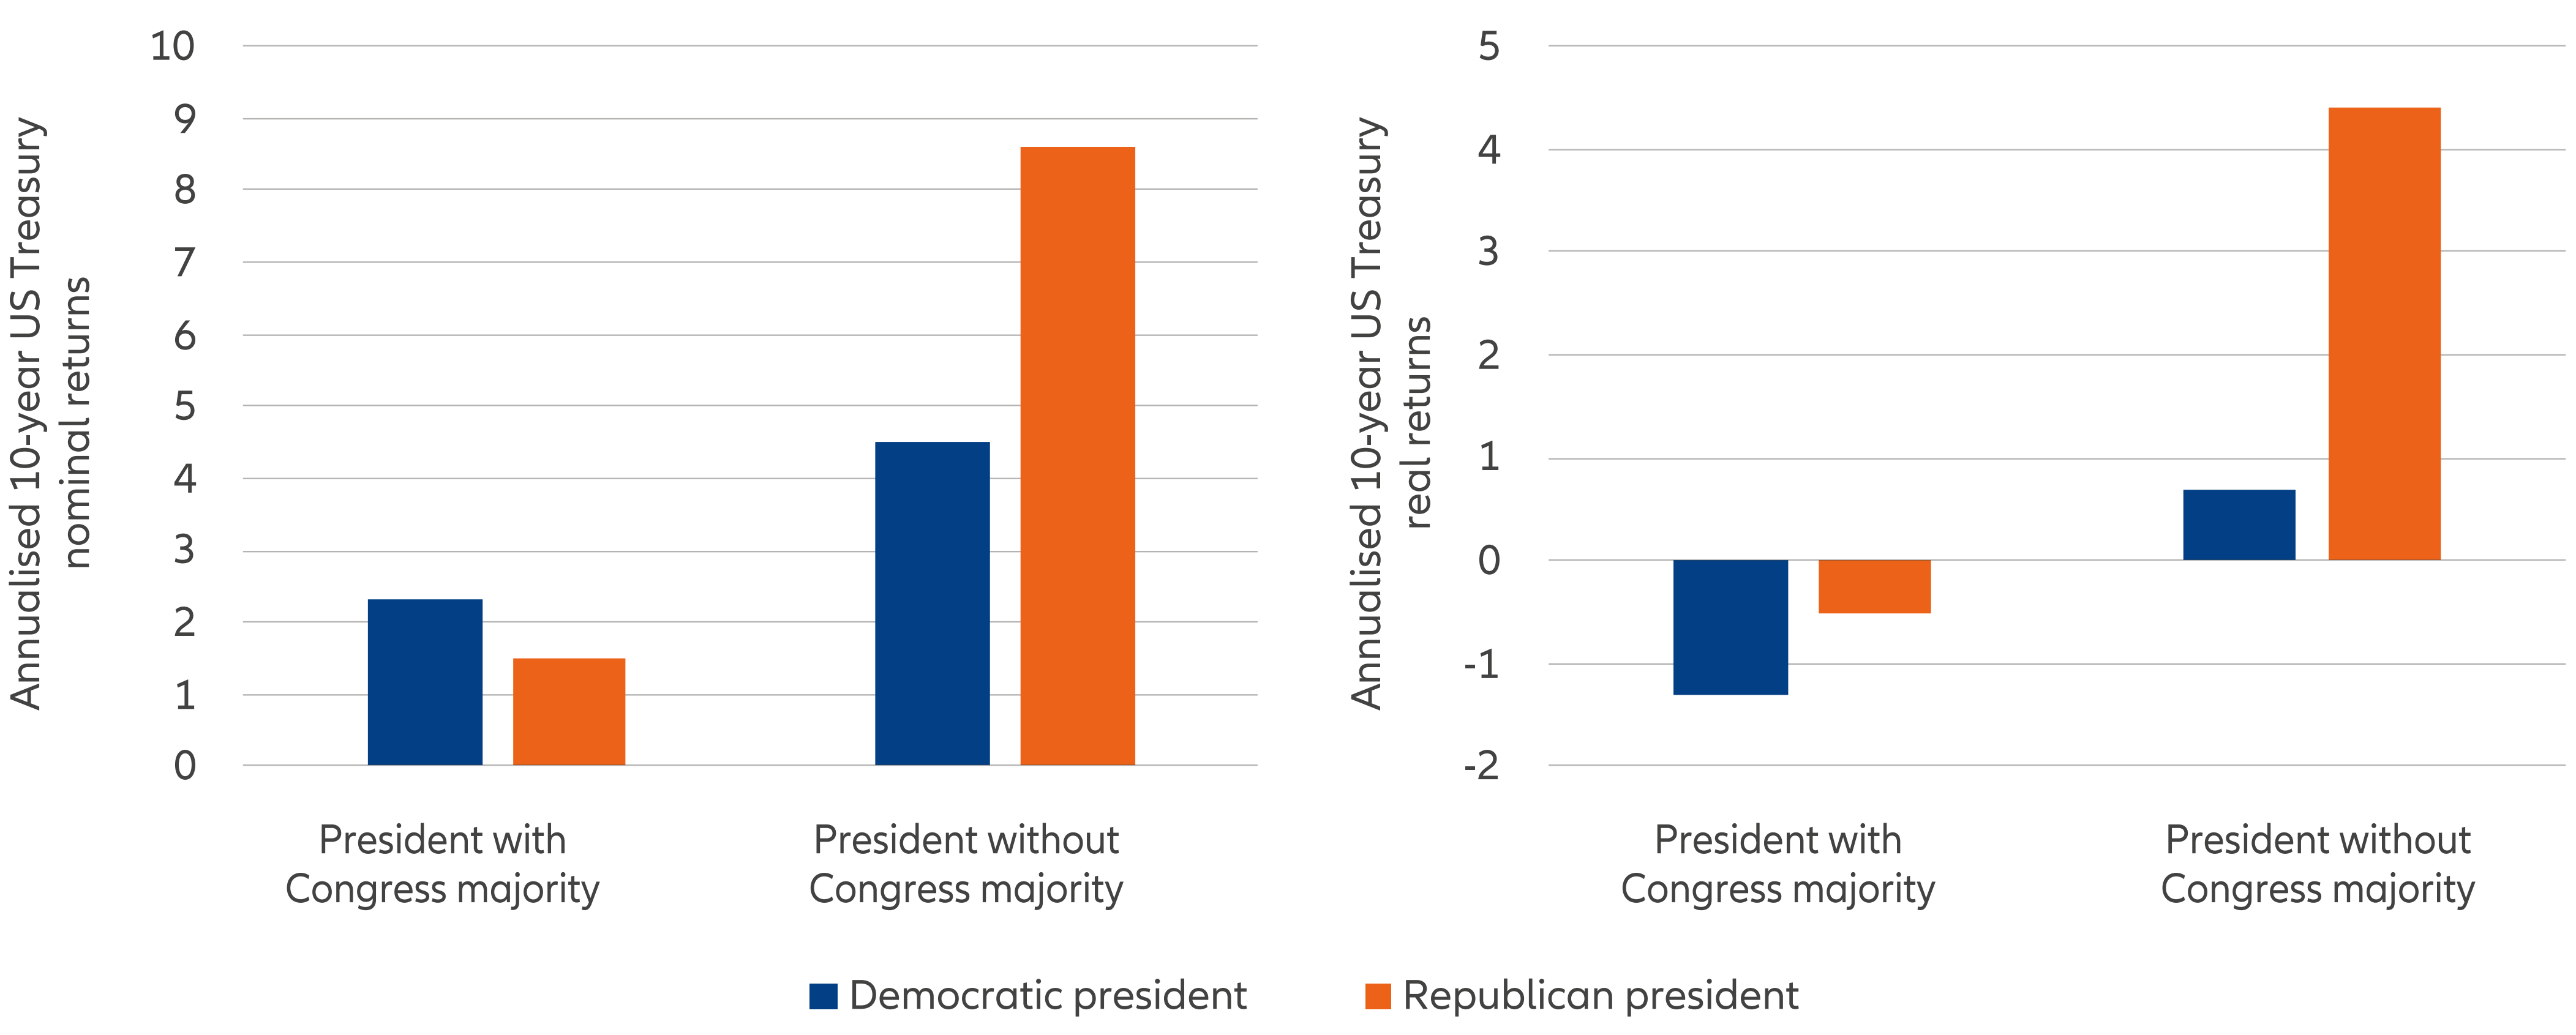
- Treasuries did best in nominal terms (8.6%) under Republican presidents without a Republican majority in Congress (see Exhibit 2).
- Next best returns came under Democratic presidents without a Democrat majority in Congress (4.5%).
- Bonds did less well under a Democrat president with a Congress majority (2.3%).
- Worst performance was under a Republican president with a Republican majority (1.5%).
Real term returns were generally similar. Treasuries shone under Republican presidents without a majority in Congress (4.4%). Performance was negative if the party had a Congress majority (-0.5%), but still better than under a Democratic president with a Congress majority (-1.3%).
Exhibit 2: US Treasuries tend to thrive under Republican presidents without a Congress majority

Source: AllianzGI, GFD, data as at December 2023. Note: calculations based on monthly data; respective periods always starting in November of an election year.
Higher growth and inflation under Democrats may partly explain the difference
We think there are two possible explanations for the performance listed above:
Economic activity tends to be stronger under Democratic presidents. All but two of the 12 recessions since the Second World War began under Republican presidents, a high proportion even accounting for the fact that the party has spent slightly more time in office. Under Democratic presidents, better growth has boosted equities and weighed on bonds. Conversely, weaker growth under Republican presidents has hurt equities and lifted fixed income.
But inflation tends to be higher under Democratic presidents. Three of the four worst inflationary periods were during Democratic presidencies, most recently in 2021 during President Biden’s term. Periods of lower inflation have generally occurred under Republican presidents. As a result, bonds performed better under Republican terms. Inflation can erode equity returns and in real terms equity performance was best under Republican presidents with a majority in Congress.
It is tricky to explain all the reasons behind these trends – but coincidence and major historic events play a part. Consider how Covid-19 fanned an inflationary wave that has lingered throughout President Biden’s presidency. Or how the end of the Second World War paved the way for one of the longest periods of strong economic growth and rising prosperity – a full two and a half decades that was mostly governed by Democratic presidents. That run may also have been aided by the tendency of Democratic presidents to act more quickly and pragmatically in response to slower growth.
In summary, as investors look to the potential implications of November’s election, history could be a useful guide.
Next up: look out for part two in this series, where we explore how the different asset classes might be impacted by the policies of President Biden and Donald Trump.


