

Ten Reasons to (re)consider China Equities


Recent years have been disappointing for China equity investors. Markets have pulled back under the weight of macro weakness, the property downturn and geopolitical challenges.
Our experience has been that investor sentiment towards the asset class has historically swung from being excessively optimistic to excessively pessimistic. These swings in sentiment lead to both risks and also significant opportunities.
Below we outline 10 reasons why we believe now is the time to reconsider China equities both in terms of their potential for long term returns and also the contribution they can make towards a balanced portfolio of global equity investments.
1. Underappreciated technology – China’s “AI Leap Forward”
In January 2025, DeepSeek shook financial markets when it announced the development of an AI model with the same functionality as ChatGPT but seemingly at a fraction of the cost.
Indeed, DeepSeek’s announcement has been one of many that illustrate China’s advancement across a range of technology and AI-related capabilities, including humanoid robots, autonomous driving and renewable energy.
The key takeaway is that China’s technology capabilities are far more advanced than was previously understood. As China’s technological progress becomes increasingly visible, we expect this will lead to a diverse range of investment opportunities.

2. “Don’t fight the PBoC”
The phrase “Don’t fight the Fed” was coined back in 1970, highlighting the strong correlation between US Federal Reserve policy and the direction of the US stock market. A modern interpretation could be “Don’t fight the PBoC”.
China equities ended 2024 with double-digit gains in US dollar terms, ending a three year losing streak7. Key to this turnaround was the role of China’s central bank, the People’s Bank of China (PBoC). Not only were interest and mortgage rates cut in response to economic weakness, but a range of other more pro-equity market policies were introduced.
These included buying domestic ETFs in size as well as the PBoC signalling it would act as lender of last resort to backstop the market by extending significant amounts of credit for stock repurchases. We see this as providing strong downside protection, if needed, for China A markets in particular.
Chart 1 – Shanghai Composite Index, 5 years
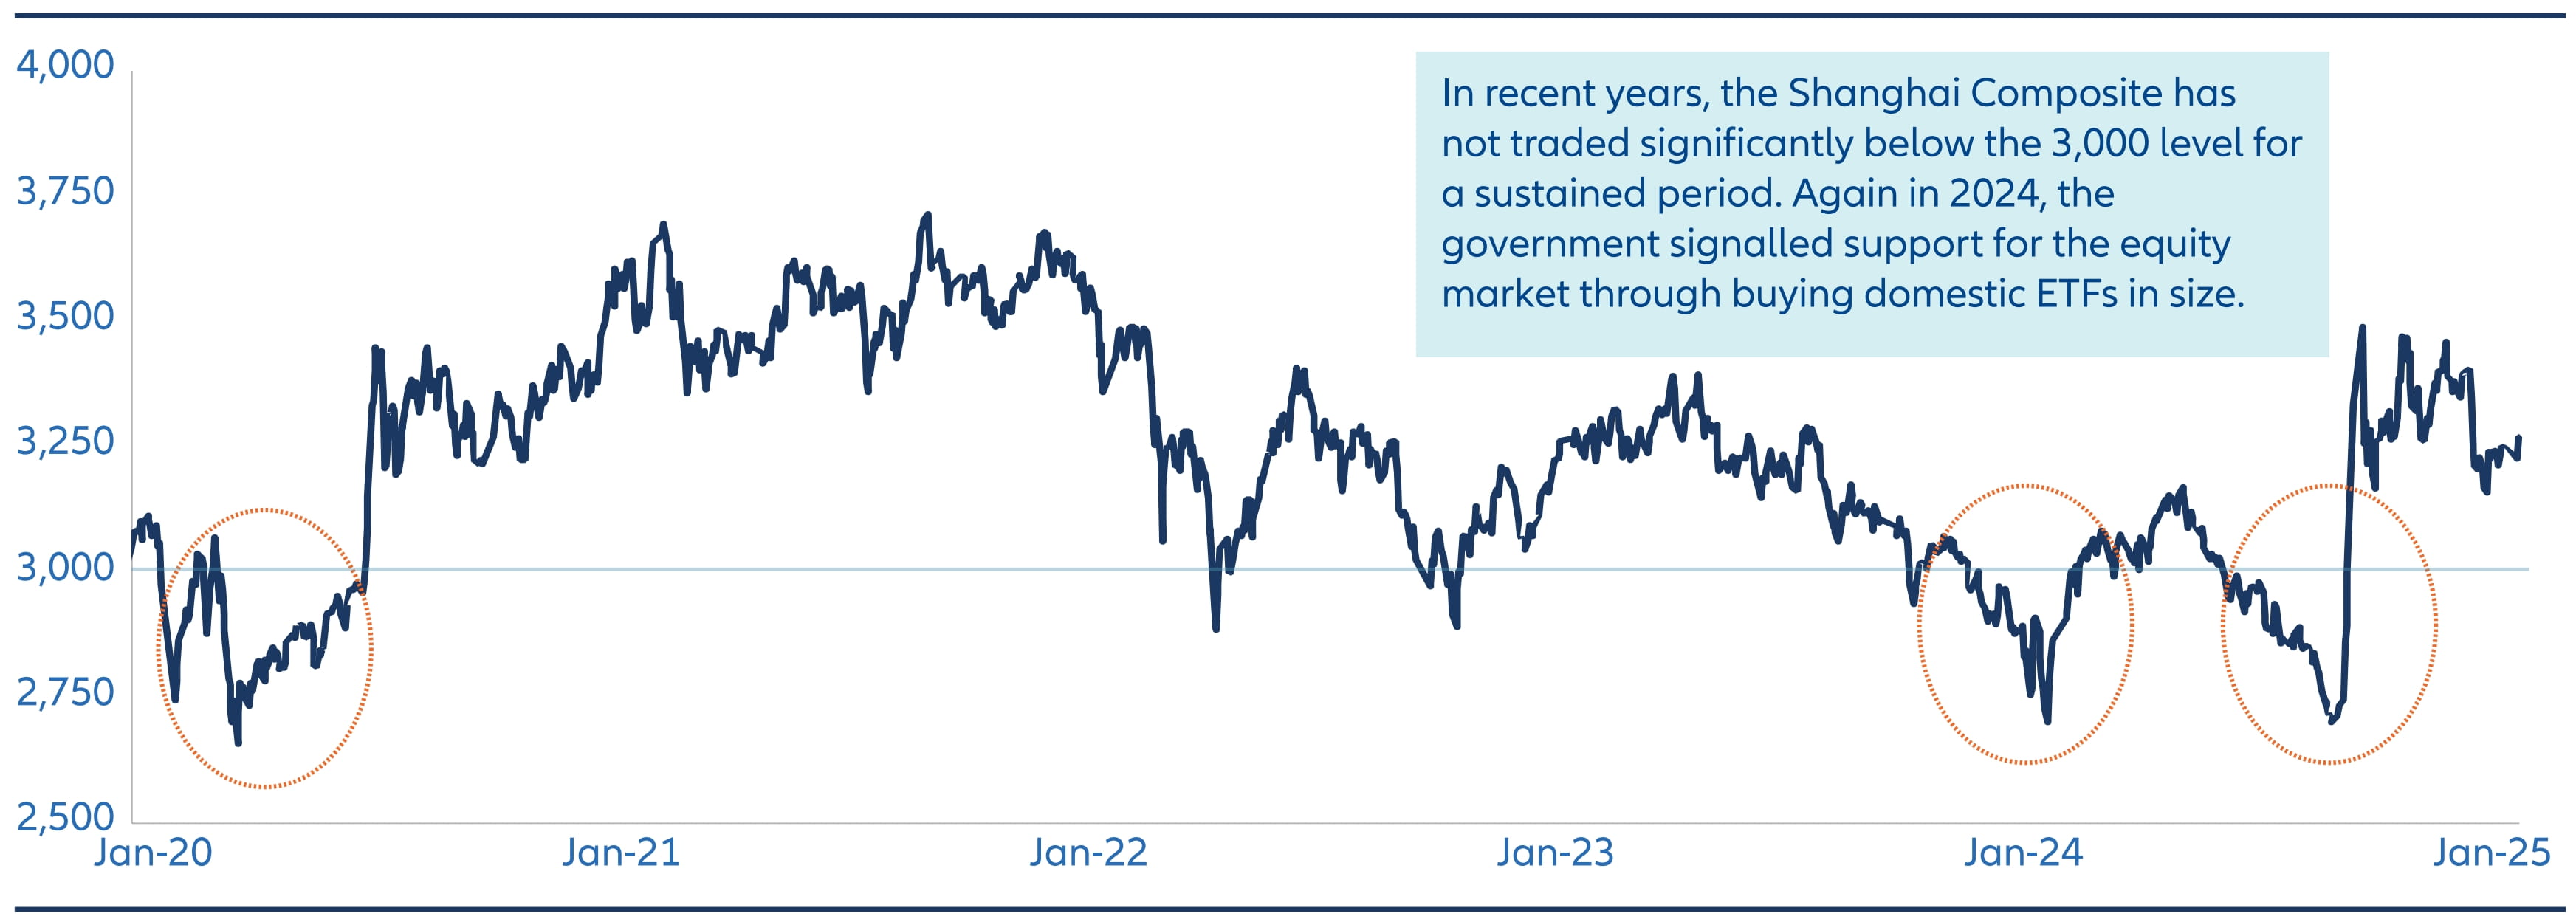
Source: Wind, Allianz Global Investors, as of 7 February 2025
3. Domestic flow of funds
Foreign investors only own around 4% of the China A market. Domestic investors are therefore the key price setters.
The outlook for domestic fund flow is encouraging. Retail investor cash levels are close to record high levels. Household deposits in banks reached the equivalent of two times the entire market capitalisation8 of China A-shares last year. With government bond yields at historically low levels, domestic equities look increasingly attractive, especially with dividend yields on mainstream indexes over 3%.
Long term we believe institutional investors such as insurance companies and pension funds will also increase their equity allocations. Current levels are significantly lower than developed market peers.
Chart 2A – CSI 300 Dividend Yield vs China 10 Year Government Bond Yield since 2015 (%)
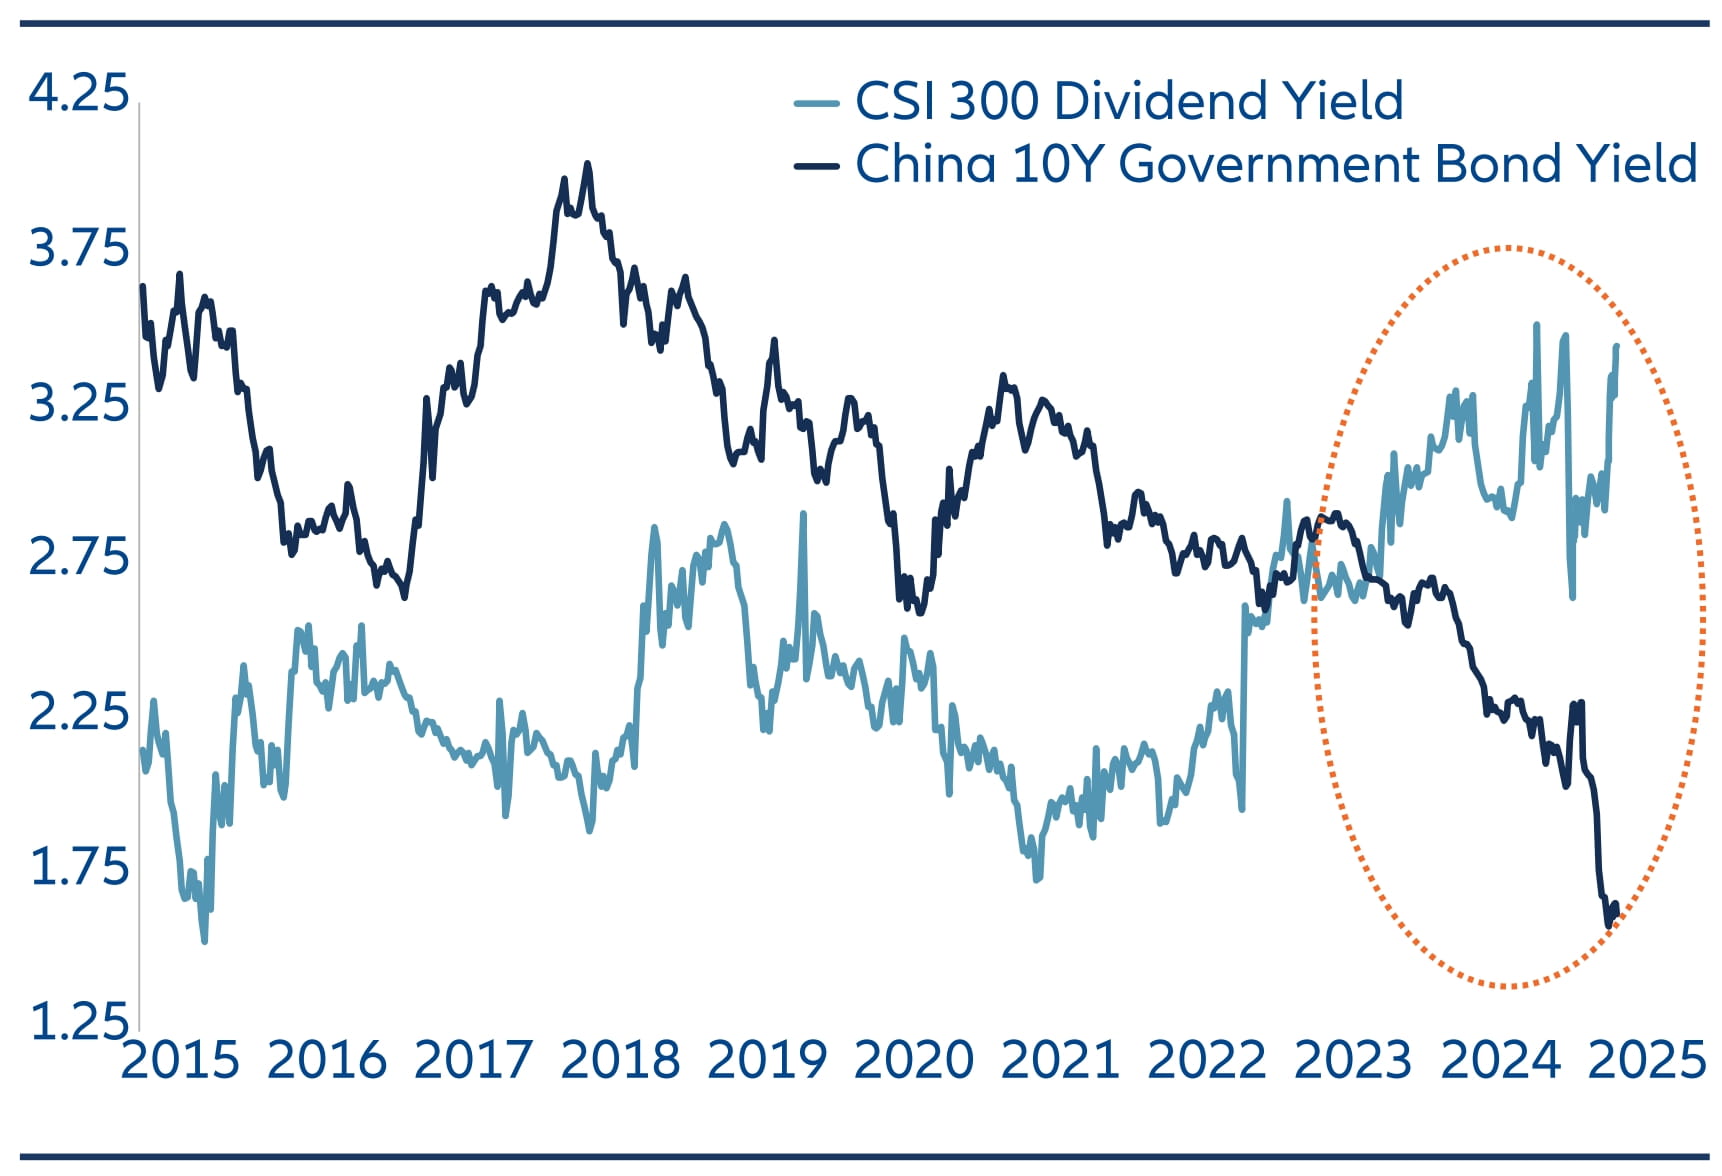
Source: Wind, Allianz Global Investors, as of 31 January 2025.
Chart 2B – Composition of household total assets of China vs US
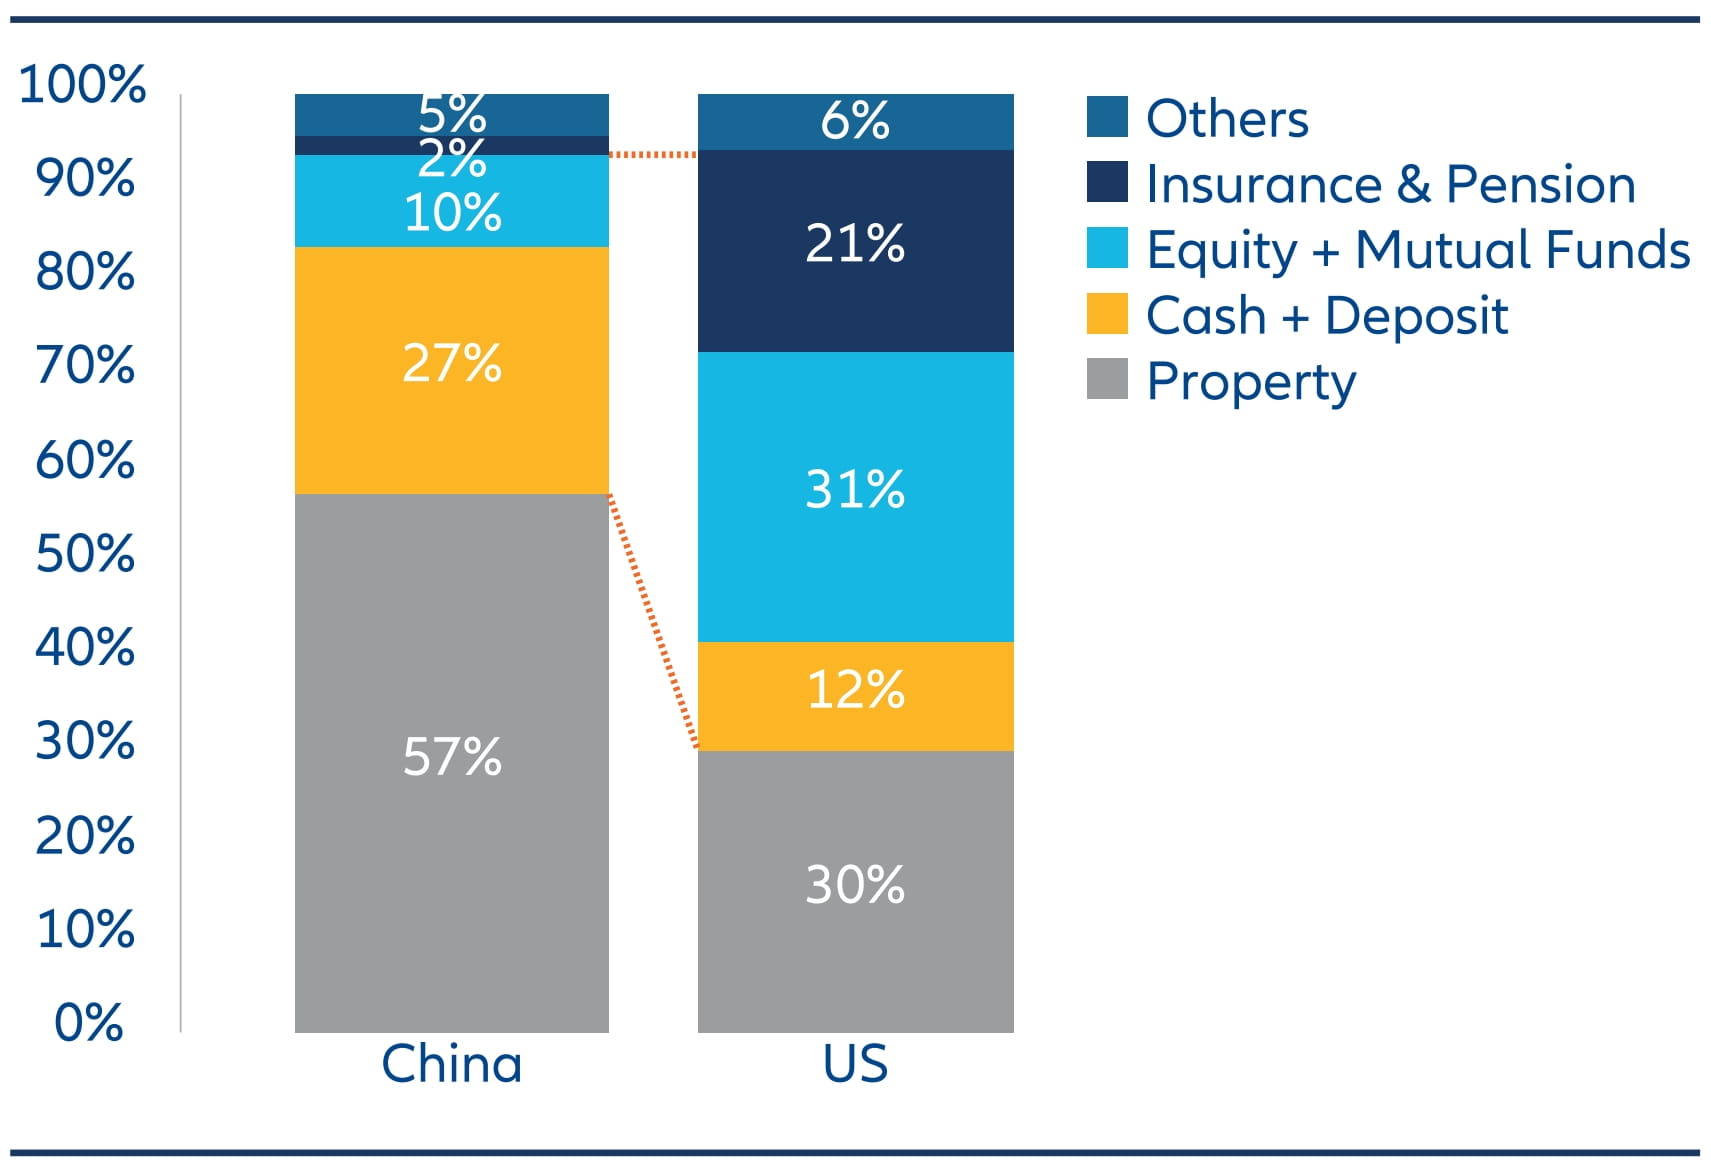
Source: NFID, CEIC, Wind, Goldman Sachs Global Investment Research, Allianz Global Investors, as of 31 December 2024.
4. Increasing share buybacks, higher dividends
It’s not only investors in China that have high cash levels – corporates do as well. Chinese companies in aggregate (ex financials) have around US$ 2.3 trillion of cash on their balance sheets. This is equivalent to around 27% of their prevailing market cap – higher than most other global markets.9
As a way of increasing the attractiveness of equity markets, regulators have taken action to enhance shareholder returns. Share buybacks in China A Shares reached record levels in 2024. While many companies previously only paid dividends once a year, a growing number have announced the addition of interim dividends going forward. More regular cash payments should be an appealing feature, especially for retail investors.
Chart 3A – China A-Share buyback volume (CNY billion, 6 months moving average)
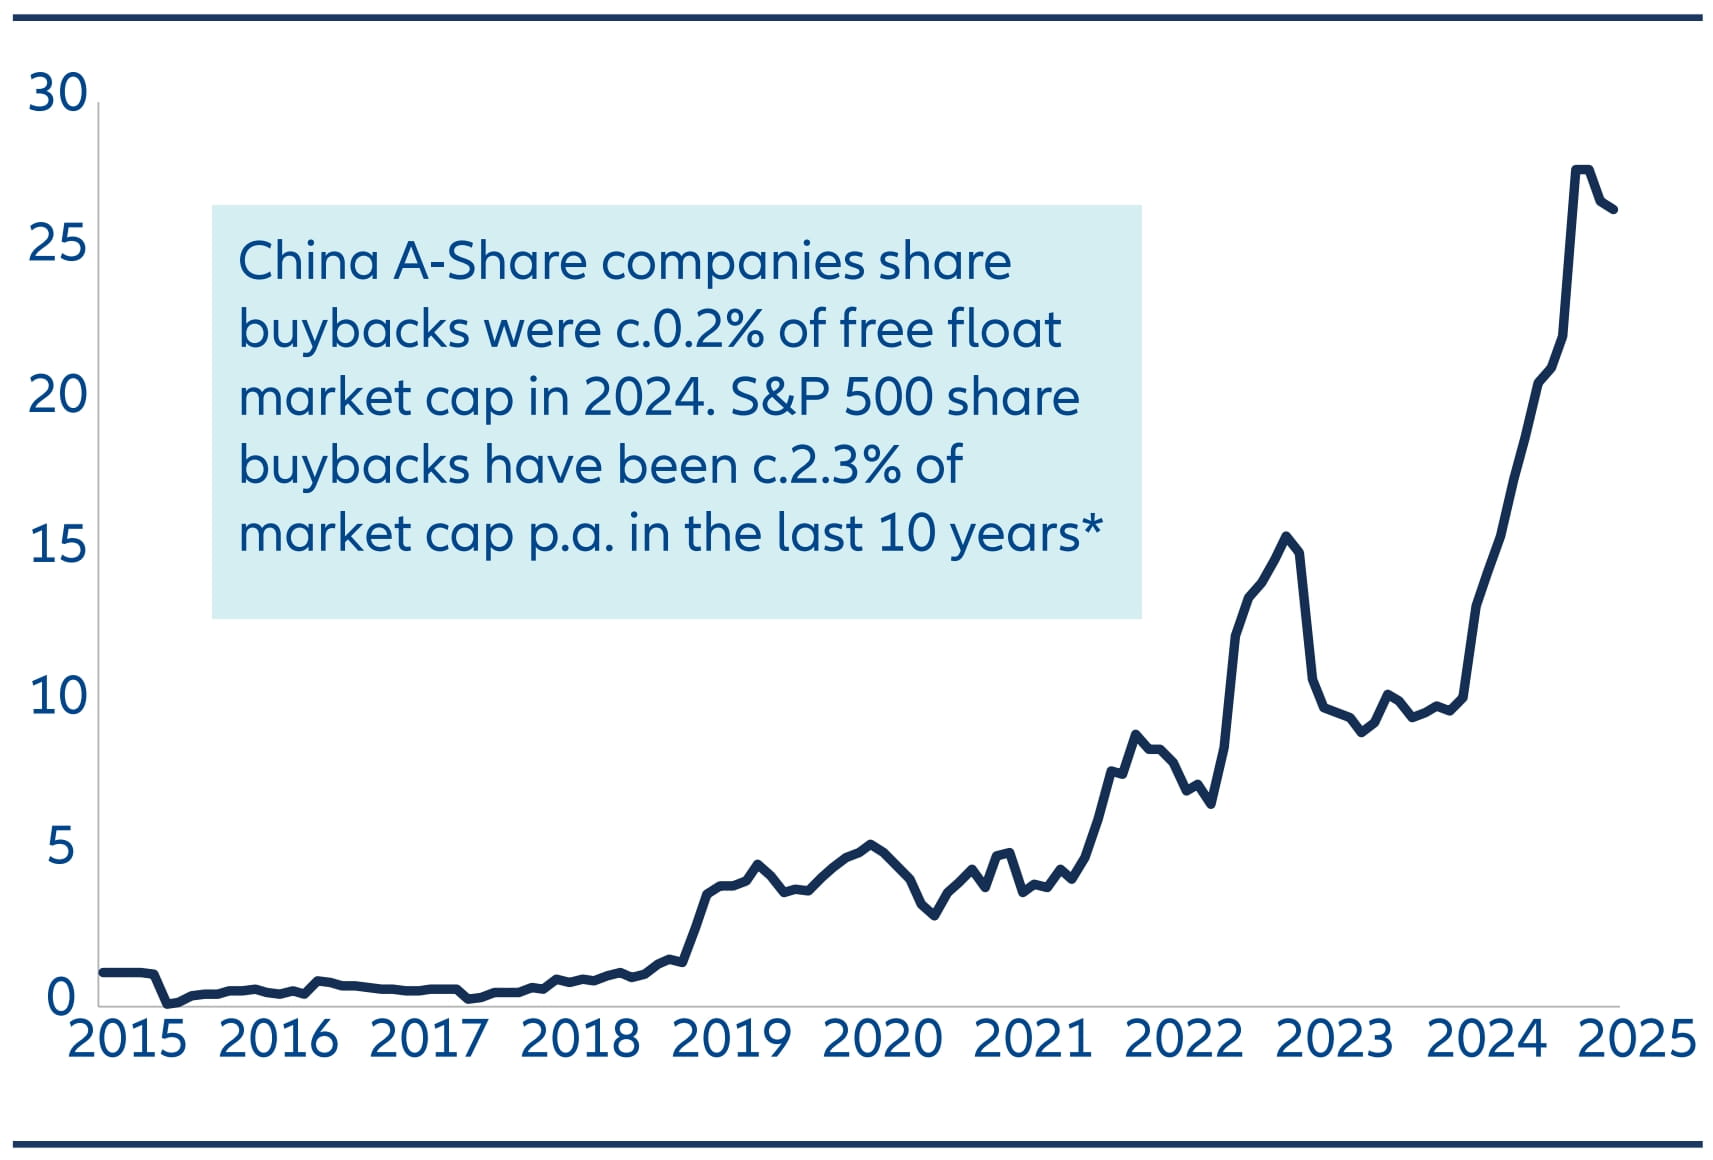
Source: Wind, Allianz Global Investors as of 31 January 2025;
*HSBC, Bloomberg, Wind as at 31 December 2024.
Chart 3B – China Equities – Cash-to-Market Cap and Dividend Payout Ratios
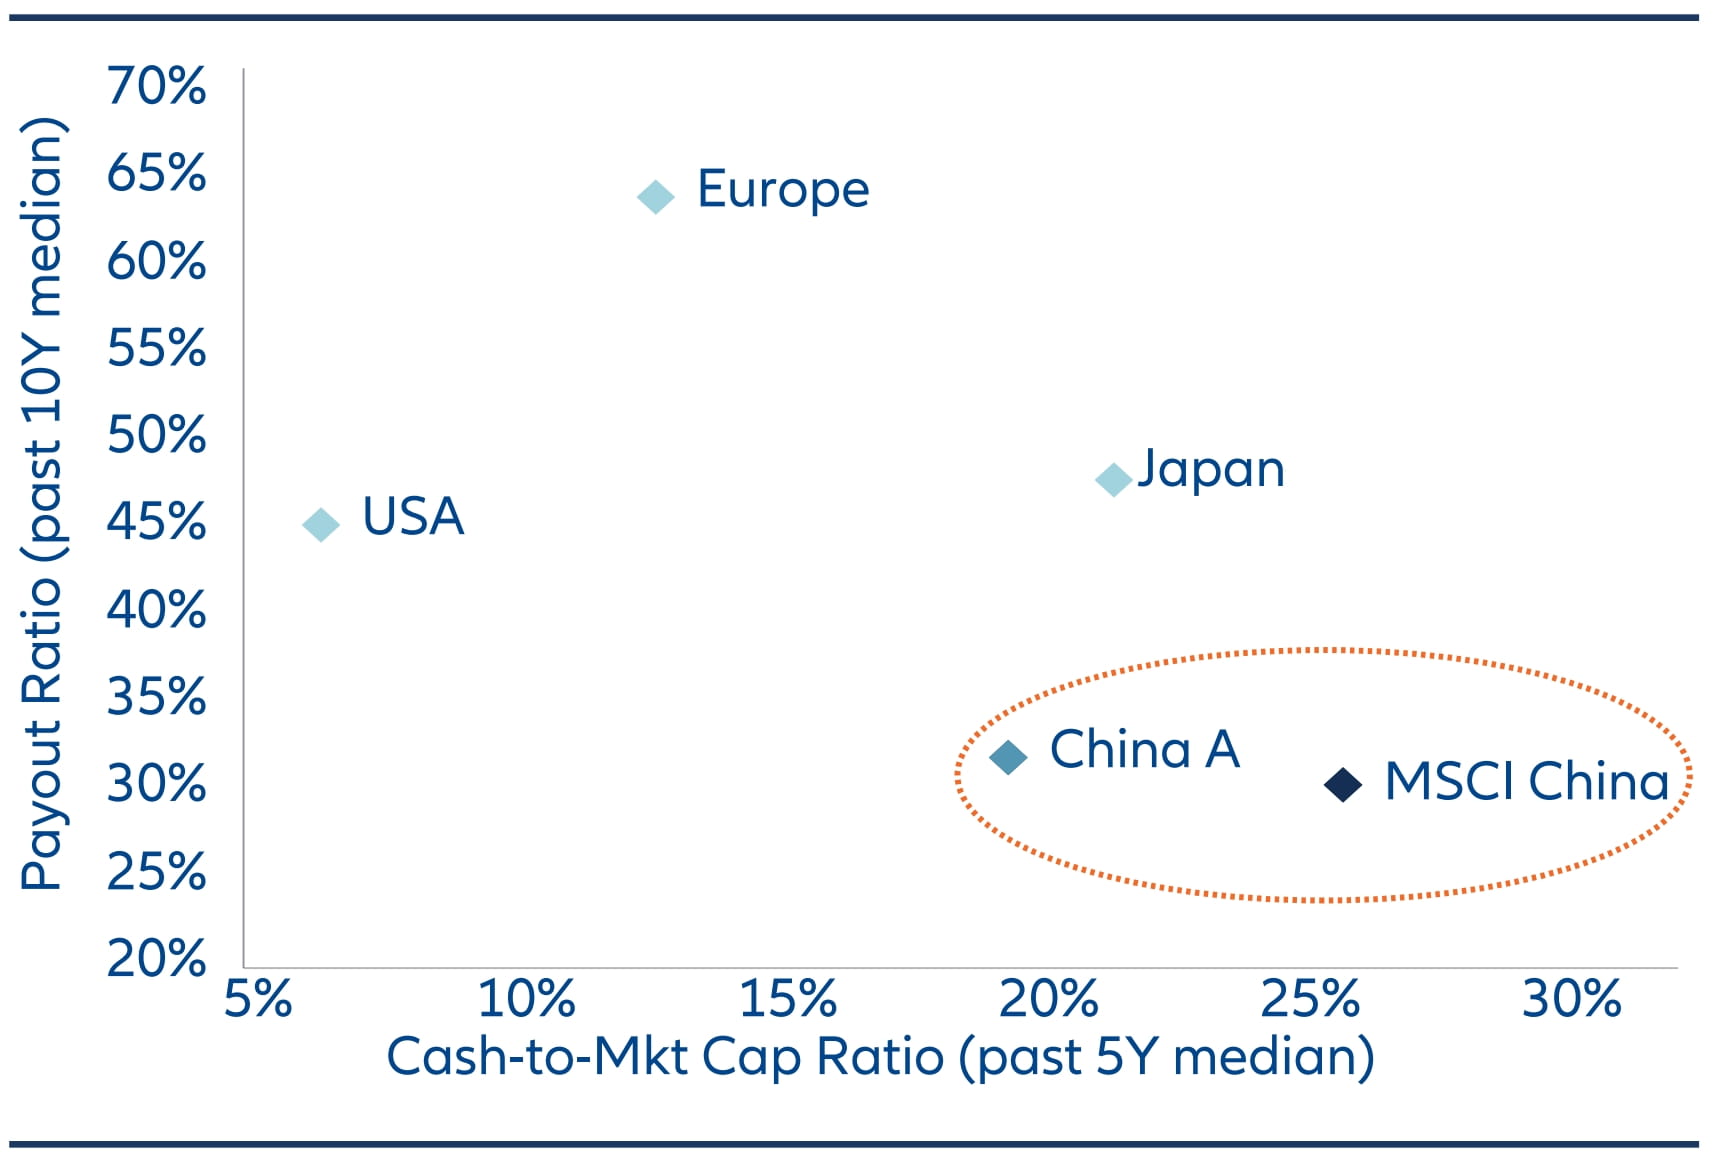
Source: Goldman Sachs as of 25 April 2024
5. Reduced level of equity issuance
In the last year, measures have been taken to address the high level of equity issuance, which has long been a headwind for the China A market.
Mainland China and Hong Kong’s combined stock market capitalization has surged from less than USD 1 trillion in 2003 to currently around USD 16 trillion.10 Over this period the number of listed China A companies has more than tripled to around 5,000.11
New regulations issued last year focused on areas such as stricter regulation of IPOs and more forceful de-listing mechanisms. Subsequently, share buybacks exceeded equity issuance in 2024 for the first time. We believe this represents a structural change which sets the scene for a more favourable balance of equity demand and supply going forward.
Chart 4 – Equity issuance and share buybacks as % of China A-shares total market cap
Source: Wind as of 31 January 2025
6. Attractive valuations
Valuations of both onshore and offshore equities are, in our view, at attractive levels. Price to book valuations are below long term historical average levels. Price to earnings valuations are optically higher, but this is because corporate earnings are at cyclically depressed levels.
Another key element from a domestic investor perspective is the widening yield gap between bonds and equities. The dividend yield of the widely followed CSI 300 Index is around 3.5% compared to the 10 year government bond yield of around 1.6%.12 In our view, this significantly enhances the relative attractiveness of China equities.
Chart 5A – MSCI China A Onshore – Forward 12 Month P/E Ratio
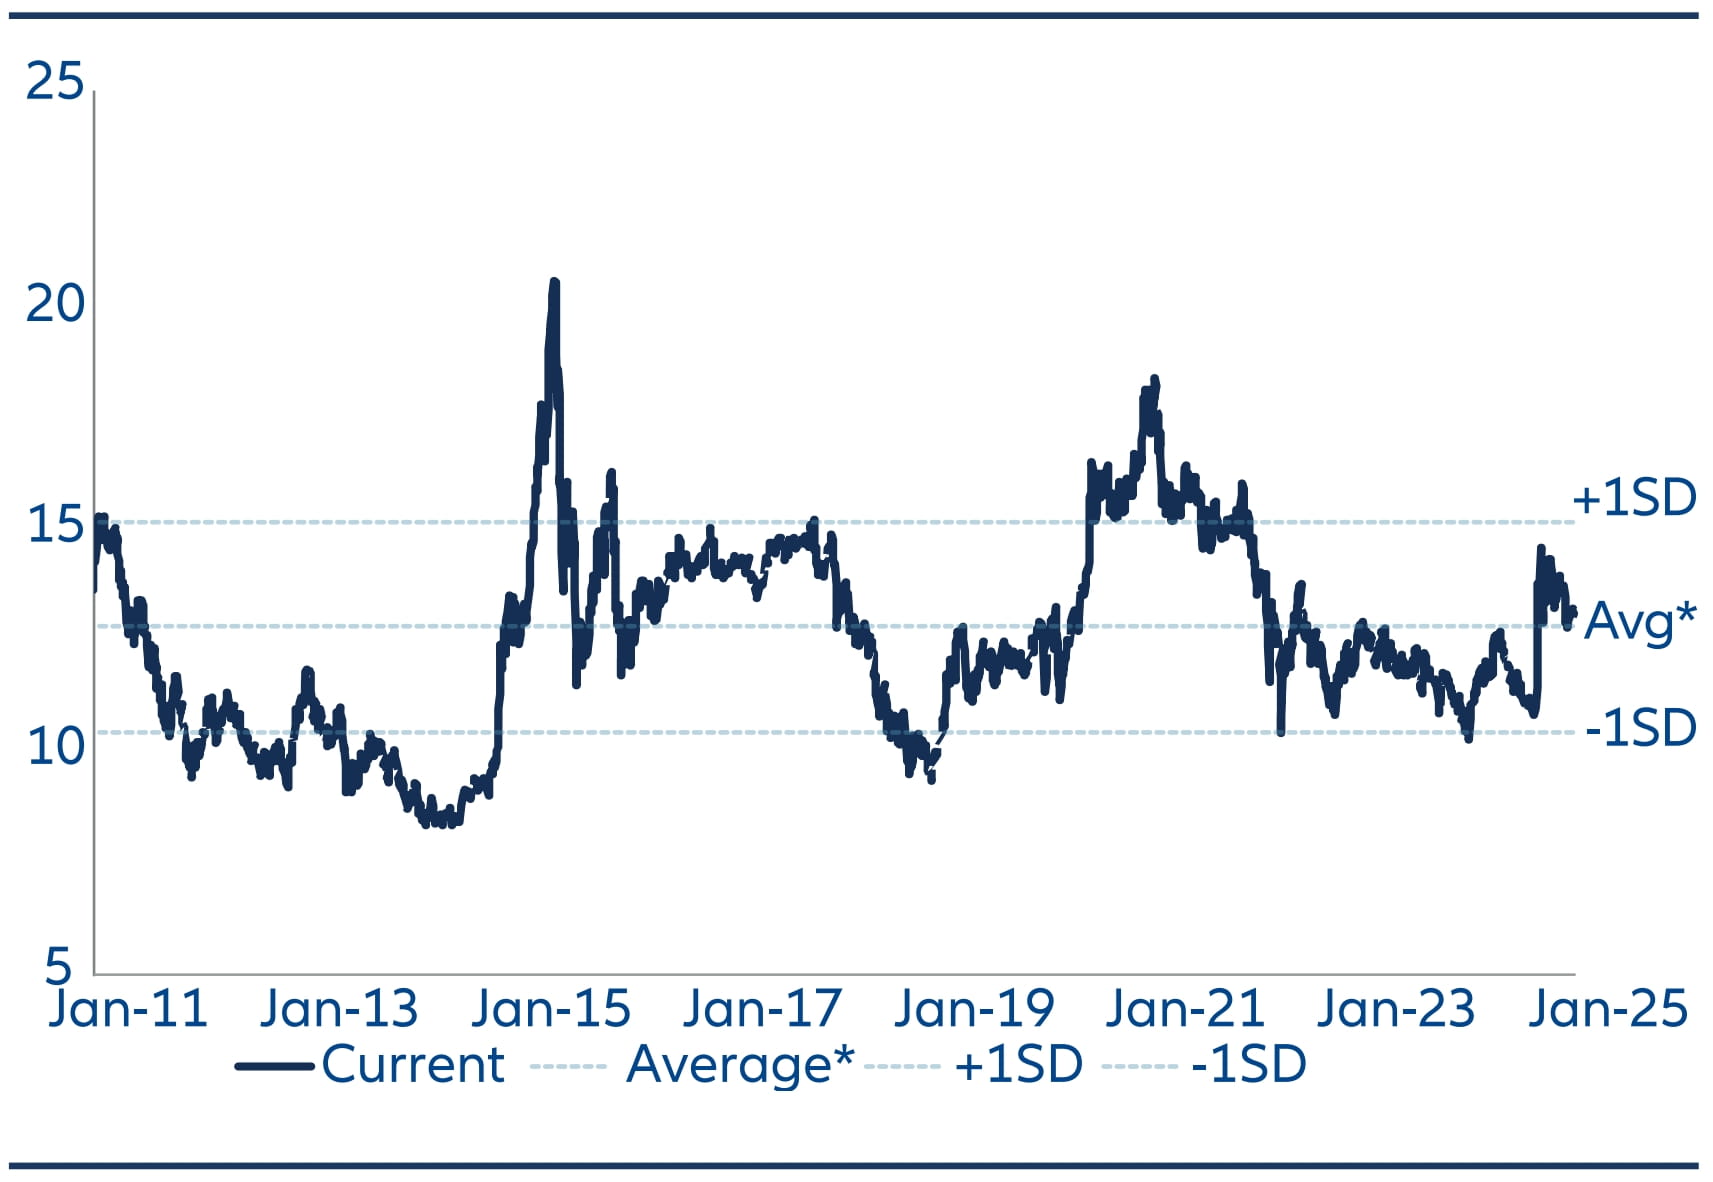
Source: Bloomberg, Allianz Global Investors, as of 6 February 2025.
*The average valuation is calculated over the period of past 15 years, or since data became available.
Chart 5B – MSCI China A Onshore – Price to Book Ratio
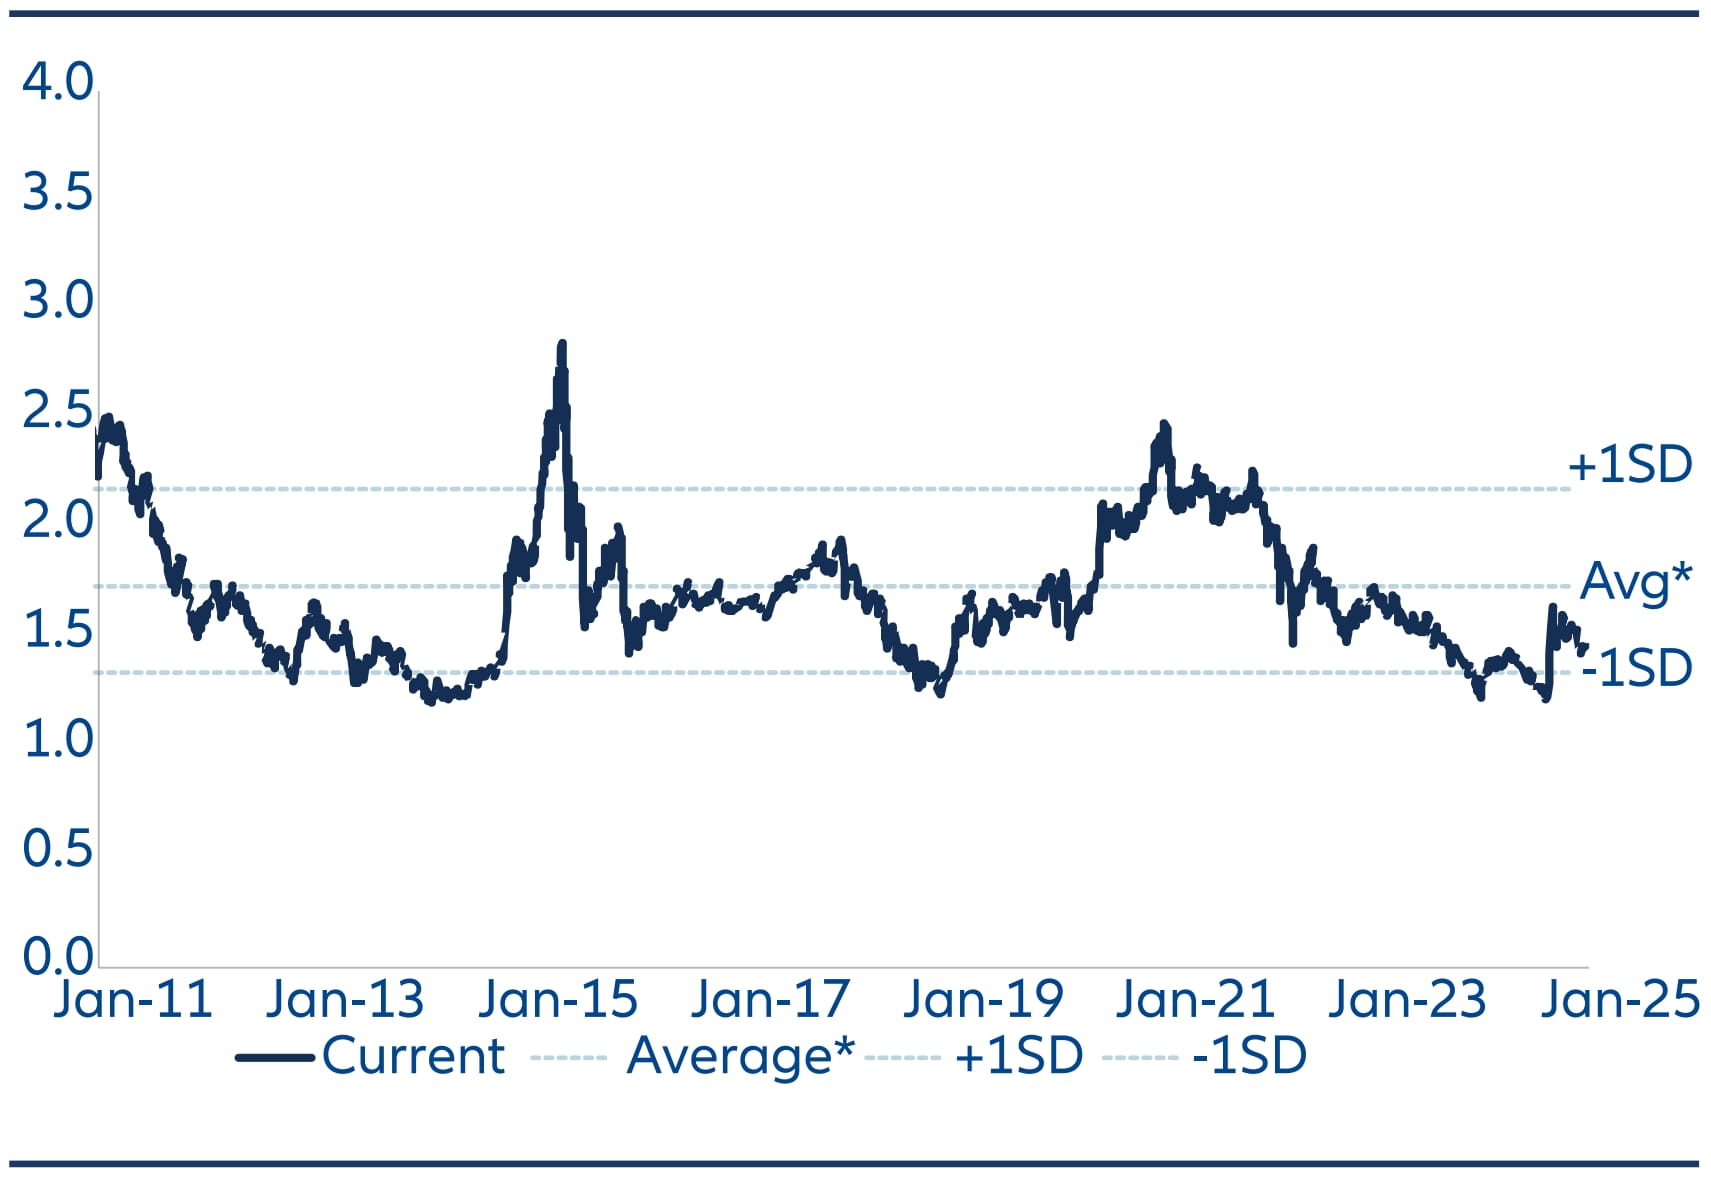
Source: Bloomberg, Allianz Global Investors, as of 6 February 2025.
*The average valuation is calculated over the period of past 15 years, or since data became available.
7. ‘You have to be in it to win it’
The pattern of China equity performance over the last year provides an important takeaway for global asset allocators. Although the market delivered double-digit returns in 2024, these happened in the space of a few weeks, triggered by unexpectedly wide-ranging and coordinated policy initiatives.
The lesson is that if you don’t already have exposure to China equities it may be very hard to react in time and catch the rally. Or, as the saying goes, you have to be in it to win it.
Chart 6 – Performance of major stock market indices since 2024 (USD, rebased to 100)
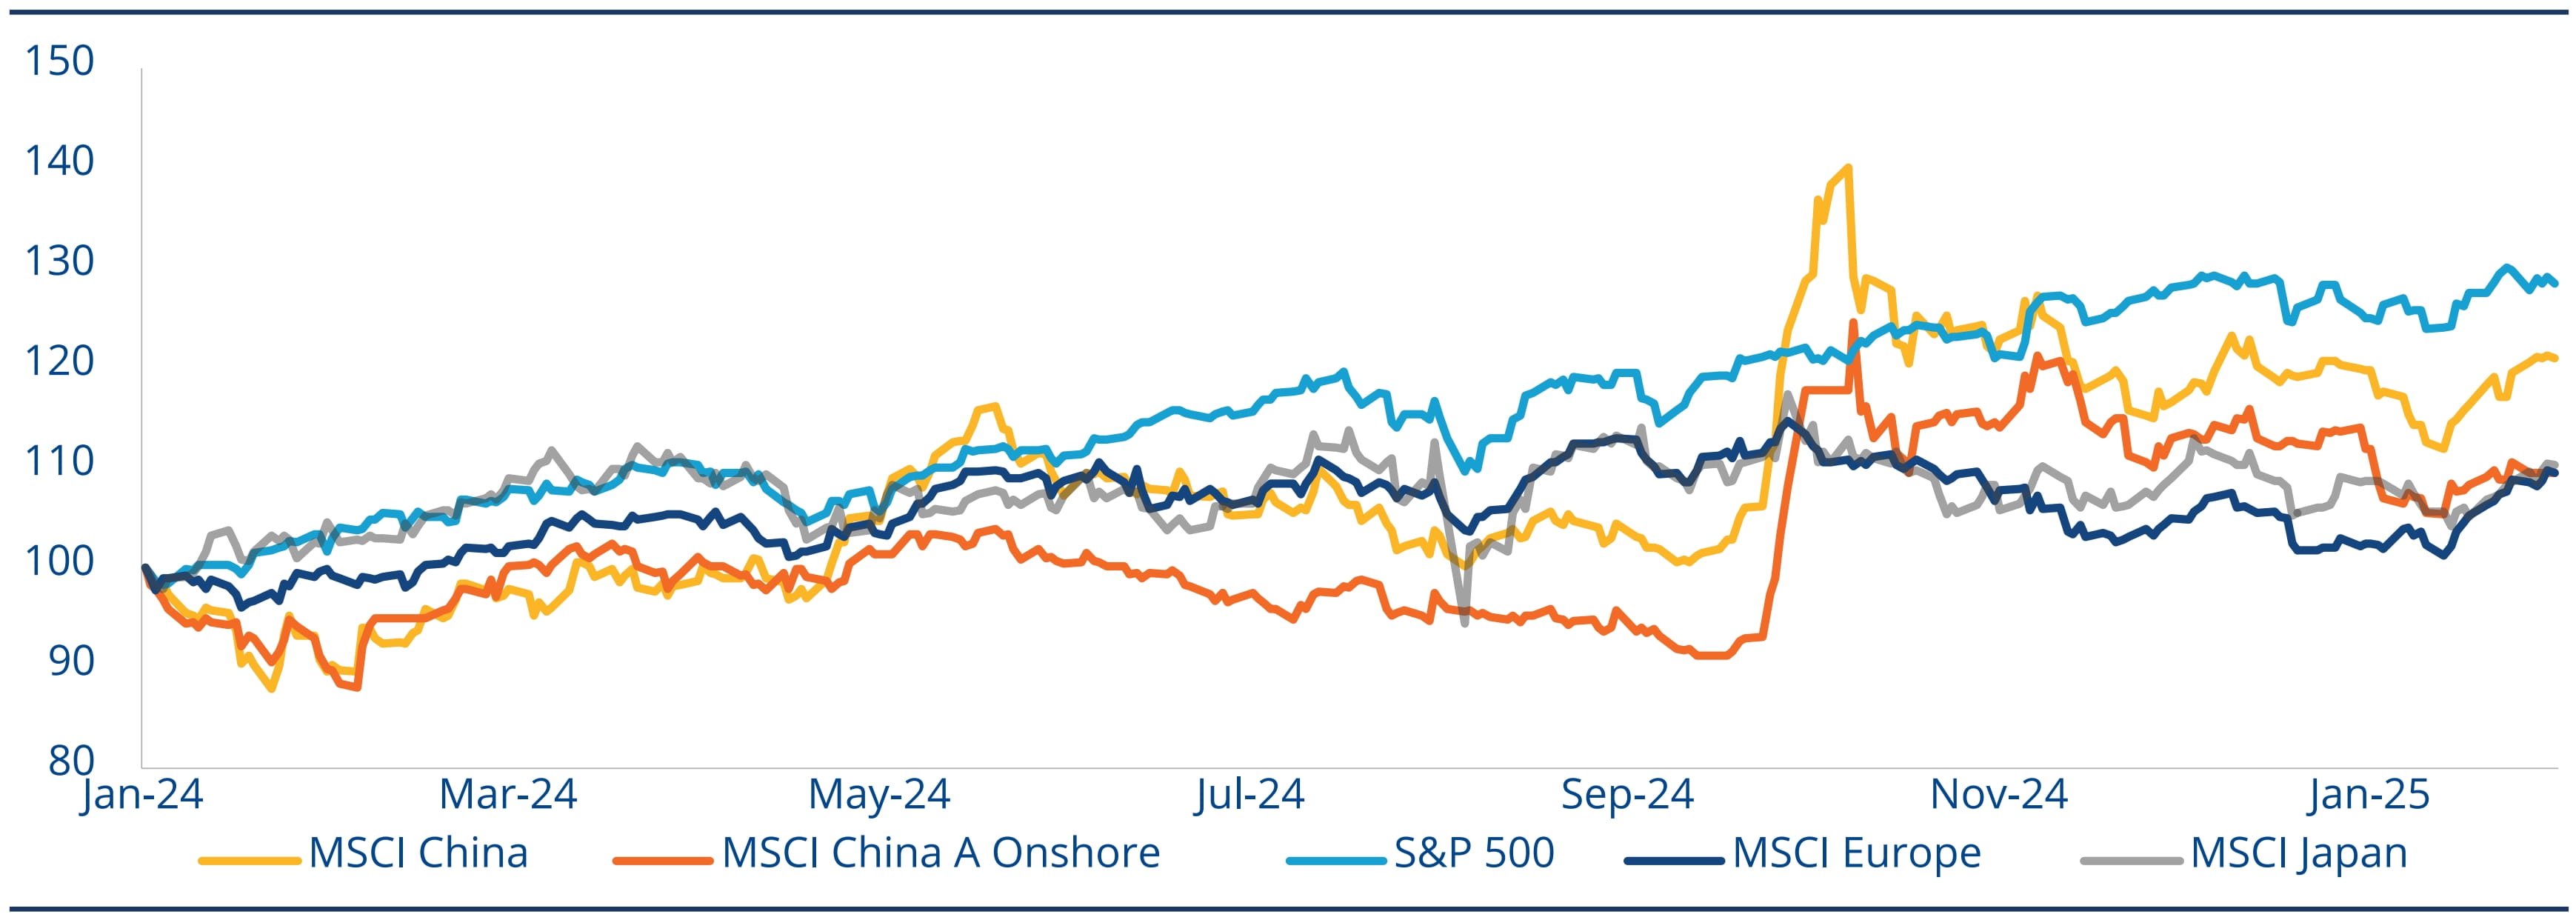
Source: LSEG Datastream, Wind, Allianz Global Investors, as of 31 January 2025.
8. Property risks increasingly in the rear view mirror
One of the key issues weighing on China equities in recent years has been risks related to the property market. While these risks still remain, our view is that the downturn in China property is nearer the end than the beginning. As such, the impact on China’s equity markets should increasingly be in the rear view mirror.
The government has implemented significant measures to stabilize the property market. This includes reducing mortgage rates, lowering downpayment ratios, and improving access to funding for cash-strapped developers.
While it will take time for confidence among homebuyers to return – indeed property prices may still have further to fall – nonetheless previous tail risk concerns have been mitigated. This is reflected in China’s bond market. The iBoxx USD Asia ex Japan China Real Estate High Yield Index bottomed in November 2023 and has returned over 70% since the low point.
Chart 7 – iBoxx USD Asia ex Japan China Real Estate High Yield Index
Source: Bloomberg, Allianz Global Investors, as of 31 August 2024.
9. Tariff risks manageable
The future path of US-China relations remains uncertain. However, we expect the impact of Trump 2.0 on China’s equity markets to be more muted the second time around.
Fundamentally, many companies have taken action to mitigate the impact of higher tariffs, often by relocating manufacturing facilities outside China. And given China has a lot to lose from a trade war – its exports to the US (USD 525 billion) are much higher than imports from the US (USD 164 billion)13 – Beijing’s response to higher tariffs will likely be more through domestic stimulus than seeking to escalate tensions. With export momentum likely to fade, an improvement in domestic demand will be needed to achieve this year’s GDP growth target.
10. Low correlations
China’s equity markets can be useful as a portfolio diversification tool. China A-Shares have a correlation of 0.33 with global equities over the last 10 years, which means they move in different directions almost 70% of the time. In comparison, Europe and global equities have a correlation of 0.82.
Therefore, holding China A-Shares in a global portfolio may help generate a better overall risk return profile.
Chart 8 – Historical correlation between major equity markets
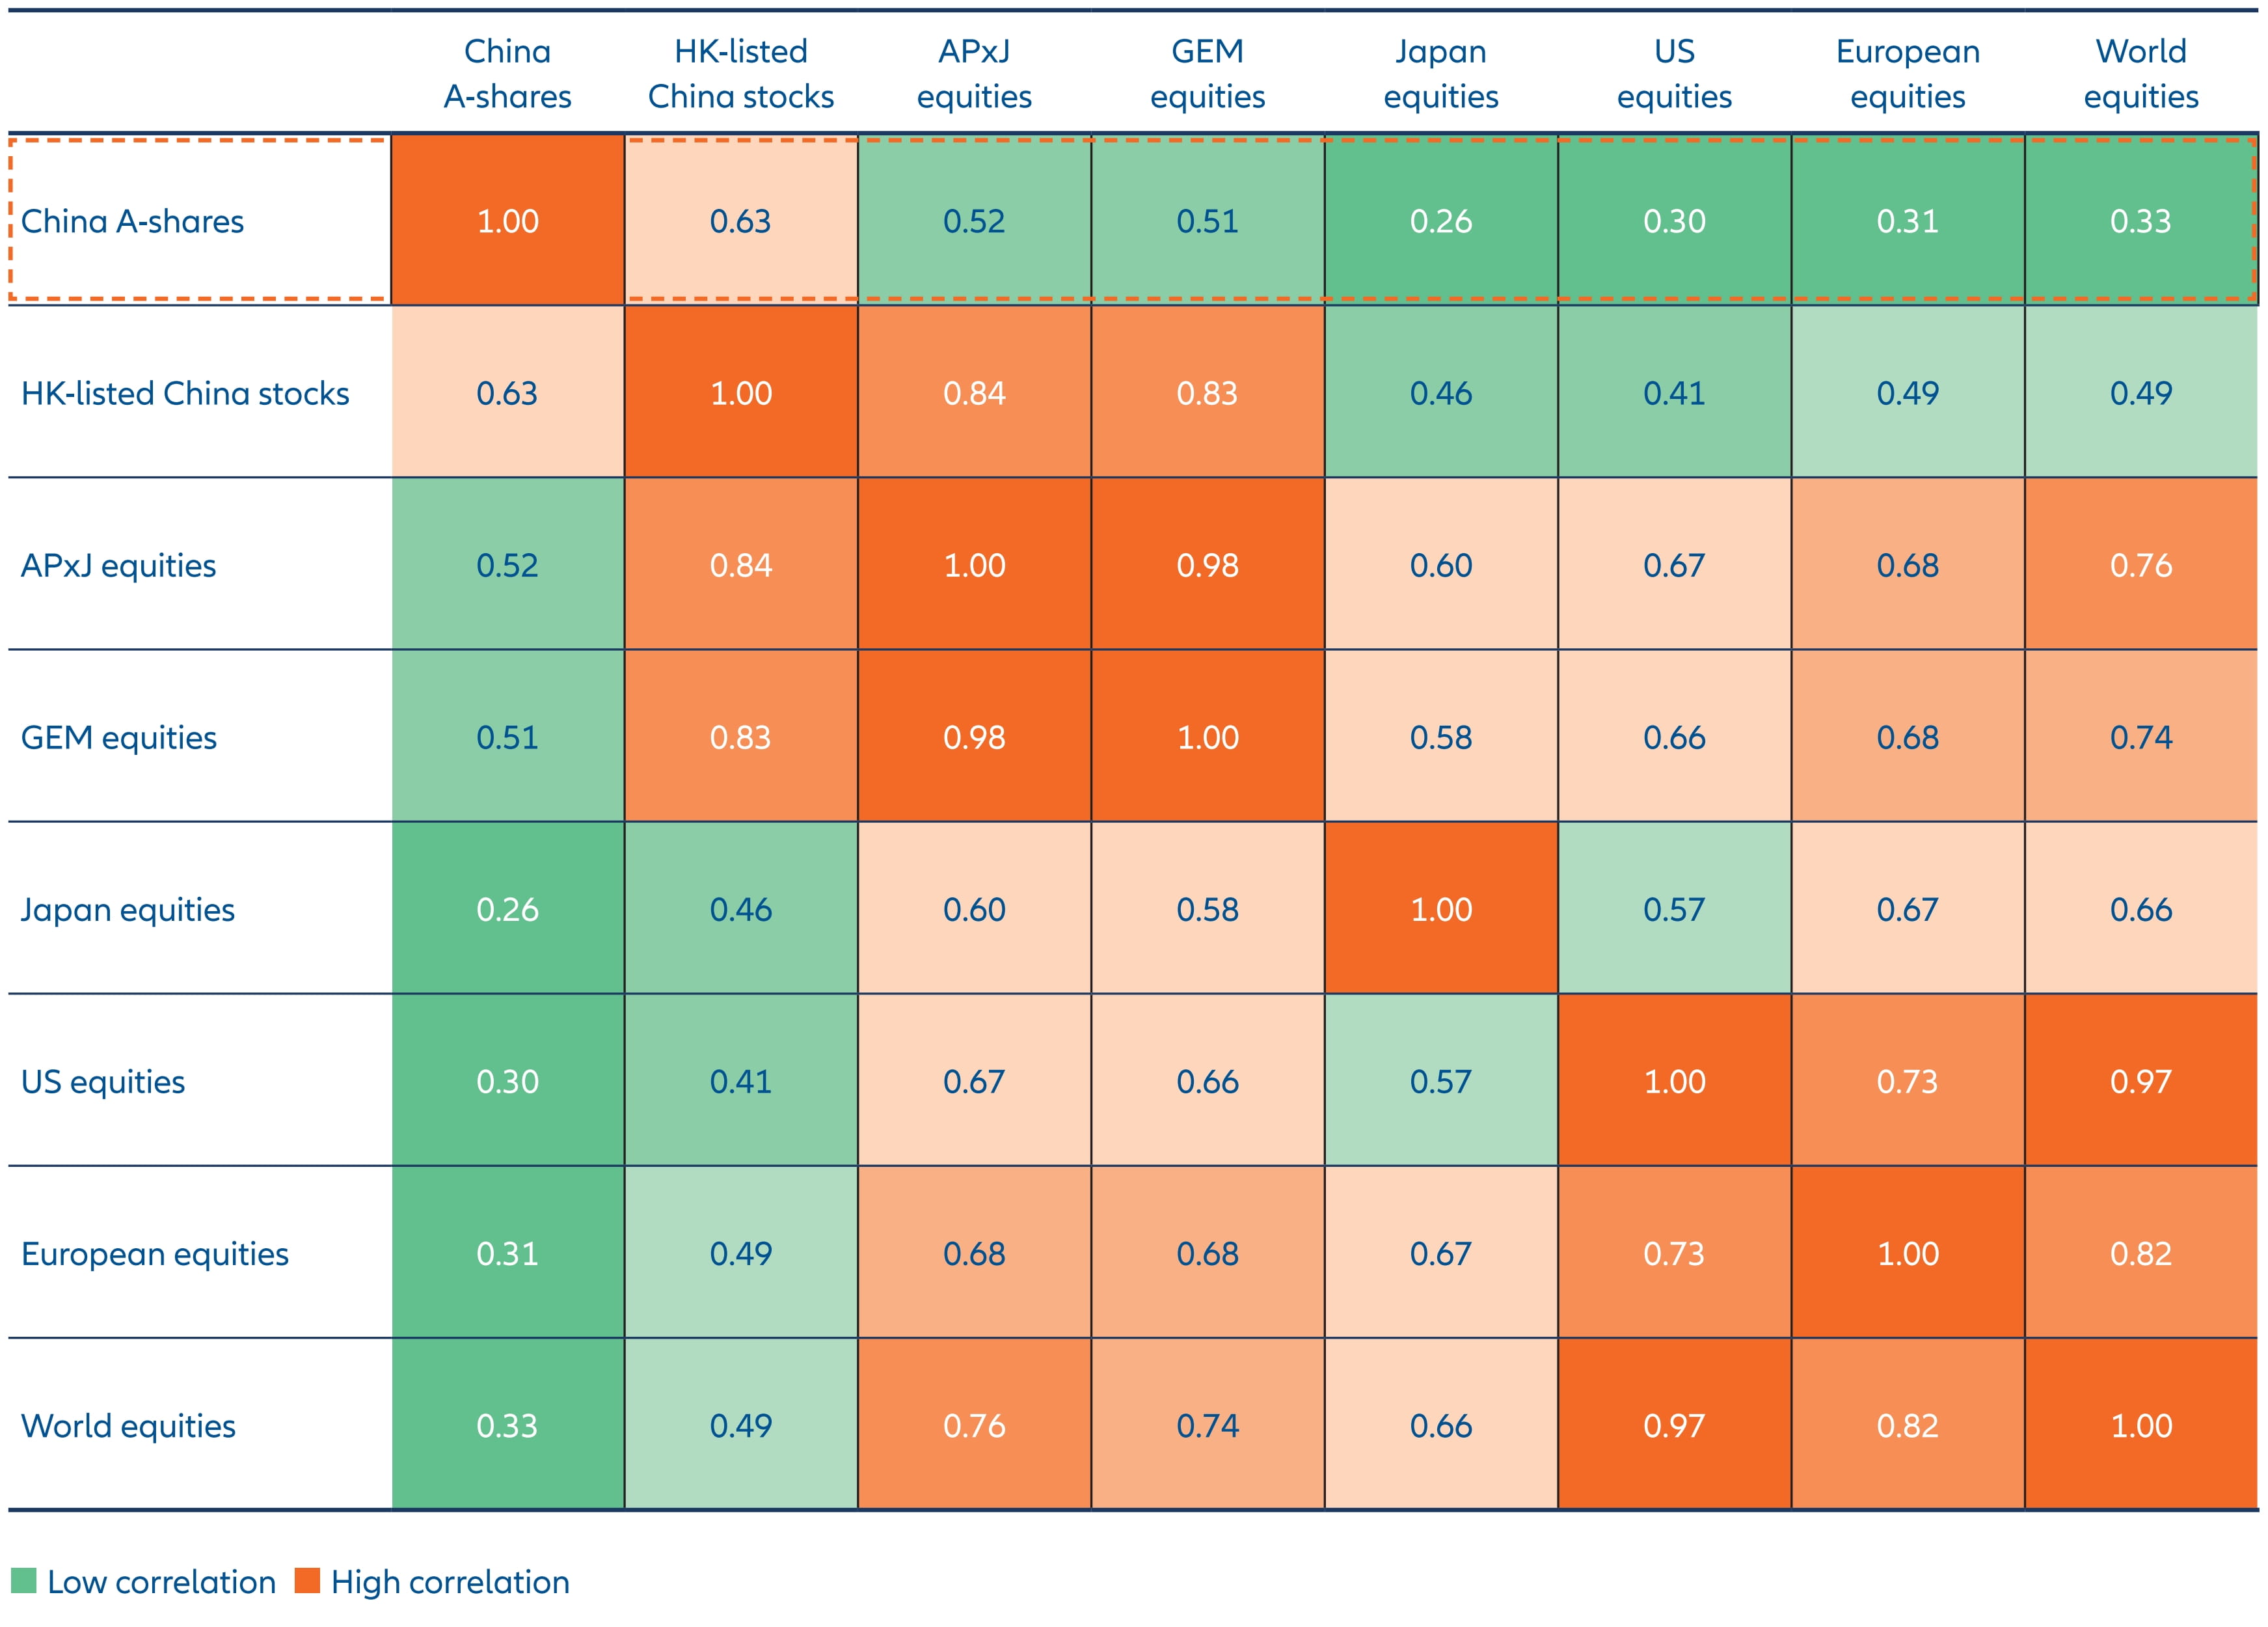
Source: Bloomberg, Allianz Global Investors, as 31 December 2024. Correlation data is calculated based on historical return of respective MSCI indices for the past 10 years, using weekly USD return
1 International Energy Agency, as of April 2024
2 Wood Mackenzie, as of November 2023
3 International Federation of Robotics, as of September 2023
4 Goldman Sachs, as of January 2024
5 Fortune, as of July 2024
6 World Intellectual Property Organization, as of July 2024
7 Based on MSCI China A Onshore Total Return Index and MSCI China Total Return Index in USD as of end 2024
8 HSBC, Wind, AllianzGI as of 31 December 2024
9 Goldman Sachs as of 25 April 2024
10 World Federation of Exchanges (WFE), Hong Kong Stock Exchange, Wind, Top Foreign Stocks, Allianz Global Investors, as of
30 November 2024
11 Wind as of 31 December 2024
12 Wind as of 31 December 2024
13 Macquarie, 3 February 2025

