Navigating Rates
How could Fed rate cuts affect asset returns?

Fixed income? Up (probably). Equities? It depends. With the US Federal Reserve expected to cut rates this year, what can we learn from earlier rate-cutting cycles that tells us how markets might respond? We analysed every period of rate cuts since the 1980s and found that bonds performed best.
Key takeaways
- Most market participants believe rate cuts by the Fed are likely in the coming months – even if the anticipated timing has moved back due to the surprising strength of the US economy.
- What do lower rates mean for asset classes? Our analysis of past cutting cycles showed bonds delivered the best returns; equities performance depended on whether the US economy slipped into recession or not.
- US government bonds were one of the few asset classes giving positive returns across almost all rate-cutting cycles – both leading up to a recession and when economic growth stayed positive.
- Equities did much better when the Fed cut interest rates and growth stayed positive, but stocks fell into the red on the cutting cycles in the run up to a downturn.
Rate cuts by the US Federal Reserve (Fed) seem a dead cert for 2024, according to markets. Less certain is exactly when and by how much and what the cuts could mean for the main asset classes.
To understand the potential impact on asset returns, we crunched the numbers on every period of rate cuts since the 1980s. Fixed income performed best across the nine cycles we analysed, with every segment beating returns on cash, on average. Equities performance depended on whether the US economy slipped into recession or not.
The results, which we unpack below, may offer clues about what could happen in the months ahead. Most market participants believe cuts are around the corner – even if the anticipated timing has moved back due to the surprising strength of the US economy and stronger-than expected inflation data early this year. Our view? We think the Fed may begin to lower rates around the middle of the year, although risks are skewed towards a later start.
Rate cuts’ economic impact has a bearing on asset returns
As with all central banks, the Fed typically lowers rates to try to keep the economy moving at a healthy pace and inflation in check. But history shows its actions aren’t always effective – and this can have a bearing on how asset classes fare.
For our analysis we categorised past cutting cycles – or episodes – into two groups:
Pre-recession cuts, where the Fed trimmed rates but failed to stop the economy sinking into recession.
Insurance cuts, where rates were reduced in response to slumping equity markets (1987), international financial stability risks (1998), or to bolster sluggish growth (1984, 1995) – and the Fed’s actions were successful at preventing a recession.
So, what happened to asset returns?
Fixed income: top of the pile
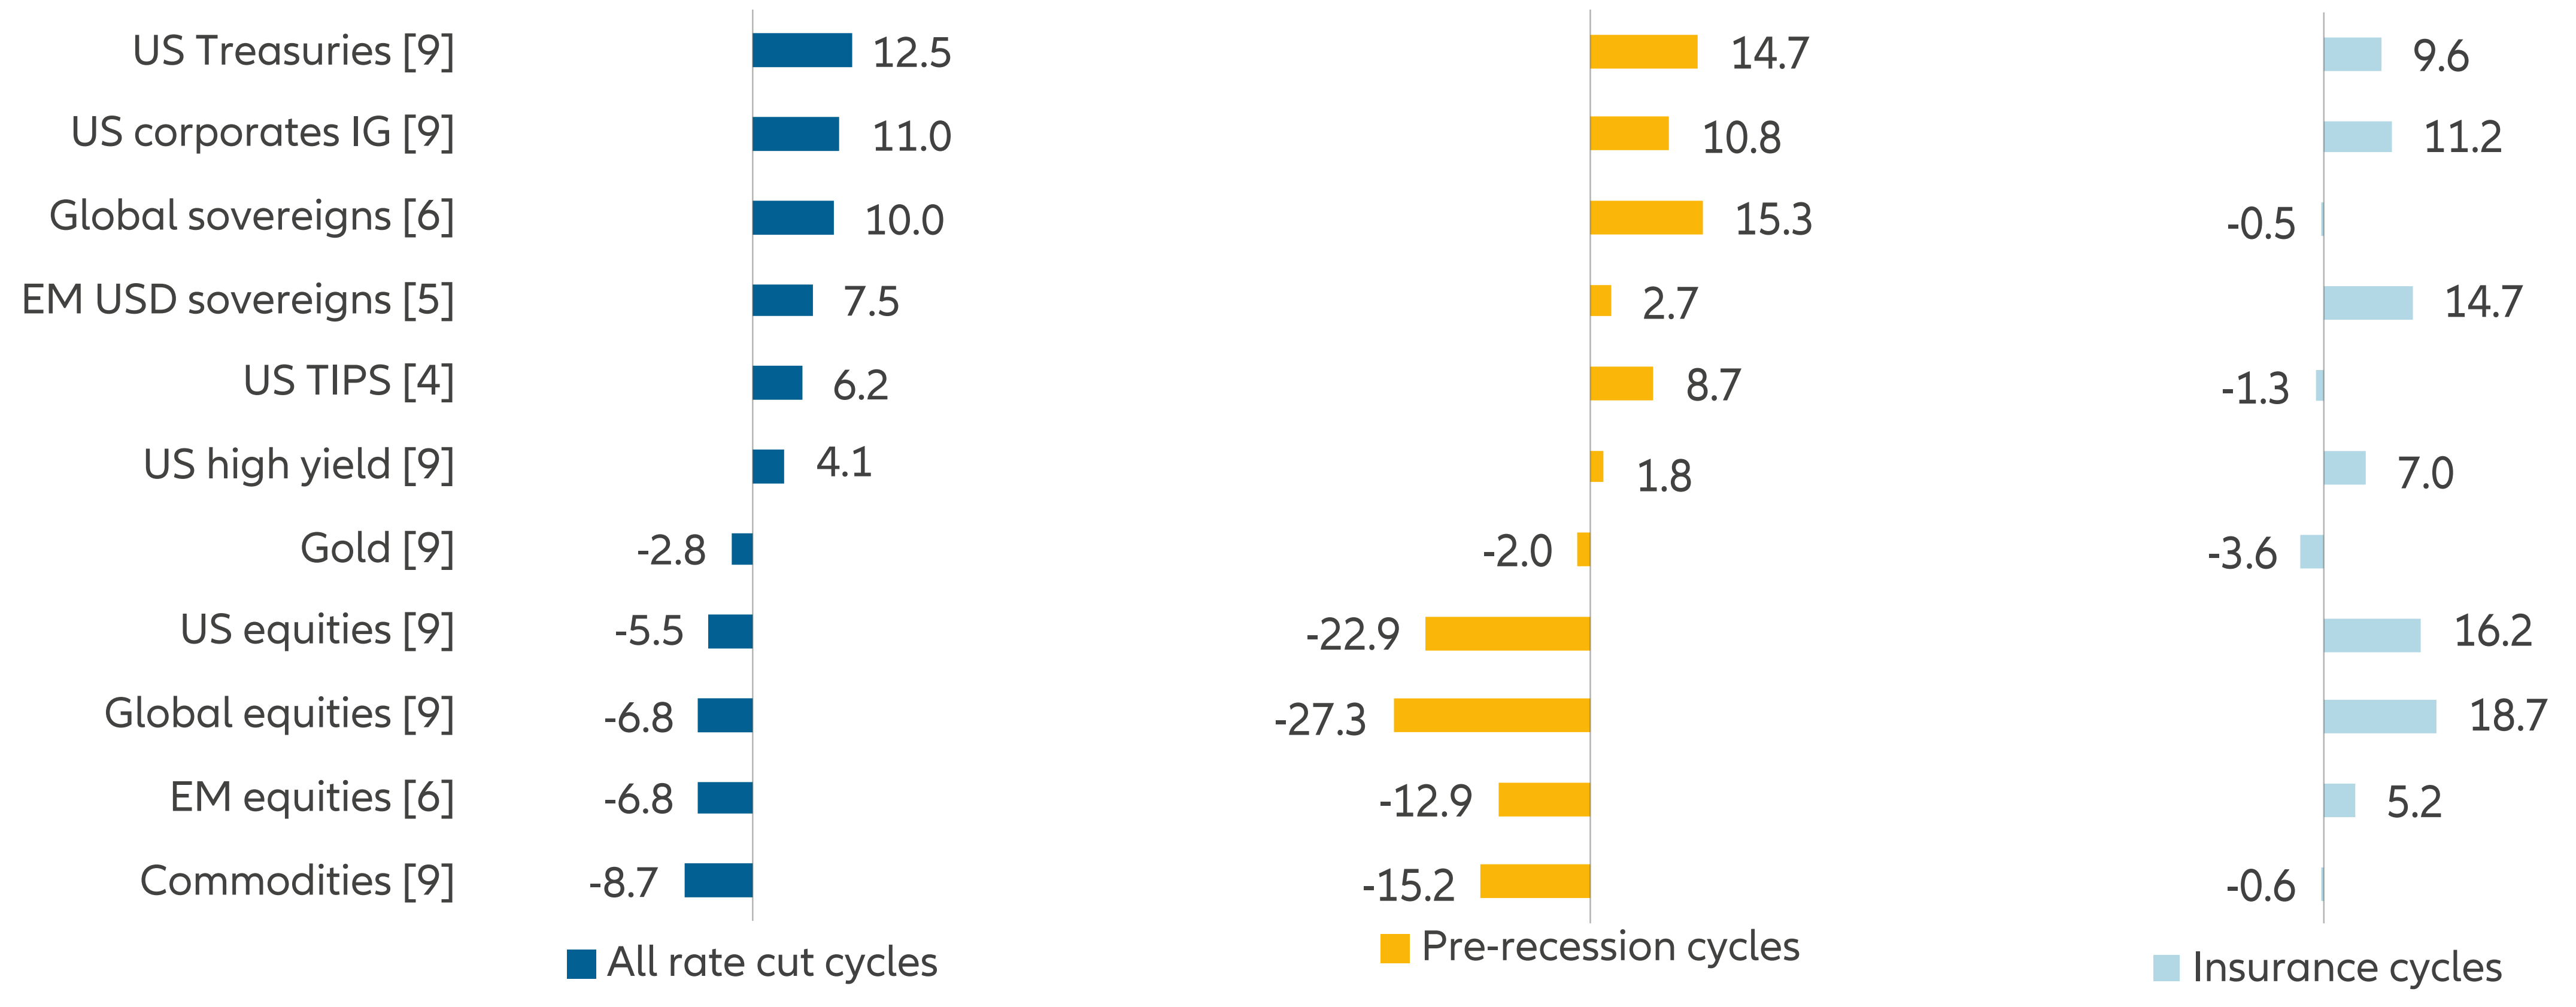
- US Treasuries were the best performer across the rate-cutting cycles we analysed: US government bonds were one of the few asset classes giving positive returns across almost all cutting cycles – both pre-recession and insurance cuts (see Exhibit 1). Excess returns over cash were negative only once (in 1998). Except for that occasion, bond yields fell significantly across all maturities. And the yield curve (10 vs 2 years) steepened during all but one instance (in 1987), signalling market anticipation of stronger economic growth ahead.
- US investment grade corporate bonds posted decent returns: Investment grade corporate bonds outperformed cash in seven of the nine cutting episodes and US Treasuries in six of the nine. The exceptions were those around the global financial crisis of 2007-08 and the Covid-19 crisis (both pre-recession cycles). Spreads versus US Treasuries tended to widen and also rose in the three to six months before the first rate cut, proving a potential leading indicator for changes in Fed policy.
- Performance of US high yield was uneven: High yield bonds provided positive excess returns versus cash in all insurance cutting cycles when growth remained positive, but returns were negative in the last two pre-recession episodes. High yield underperformed US Treasuries in the majority of episodes, as well as during the first year after the initial cut, on average.
- Mixed track record for emerging market US dollar sovereign bonds: Emerging market US dollar government bonds beat cash and US Treasuries in three of five cutting cycles since 1995. But they underperformed significantly during the global financial crisis and the Covid-19 crisis. They outperformed US investment grade and US high yield in most of the episodes since 1995.
Exhibit 1: US Treasuries performed best of any asset class during cutting cycles
Excess return vs cash (%) during Fed rate cut cycles (1981-2019)

Note: Number of underlying rate cut cycles from 1981-2019 in brackets. Pre-recession cycles: 1981, 1989, 2001, 2007, 2019, insurance cycles: 1984, 1987, 1995, 1998. All returns in local currency except for global sovereigns and global/EM equities (USD unhedged returns). Source: Allianz Global Investors Global Economics & Strategy, Bloomberg, Refinitiv (data as at February 2024)
Equities: diverging performance
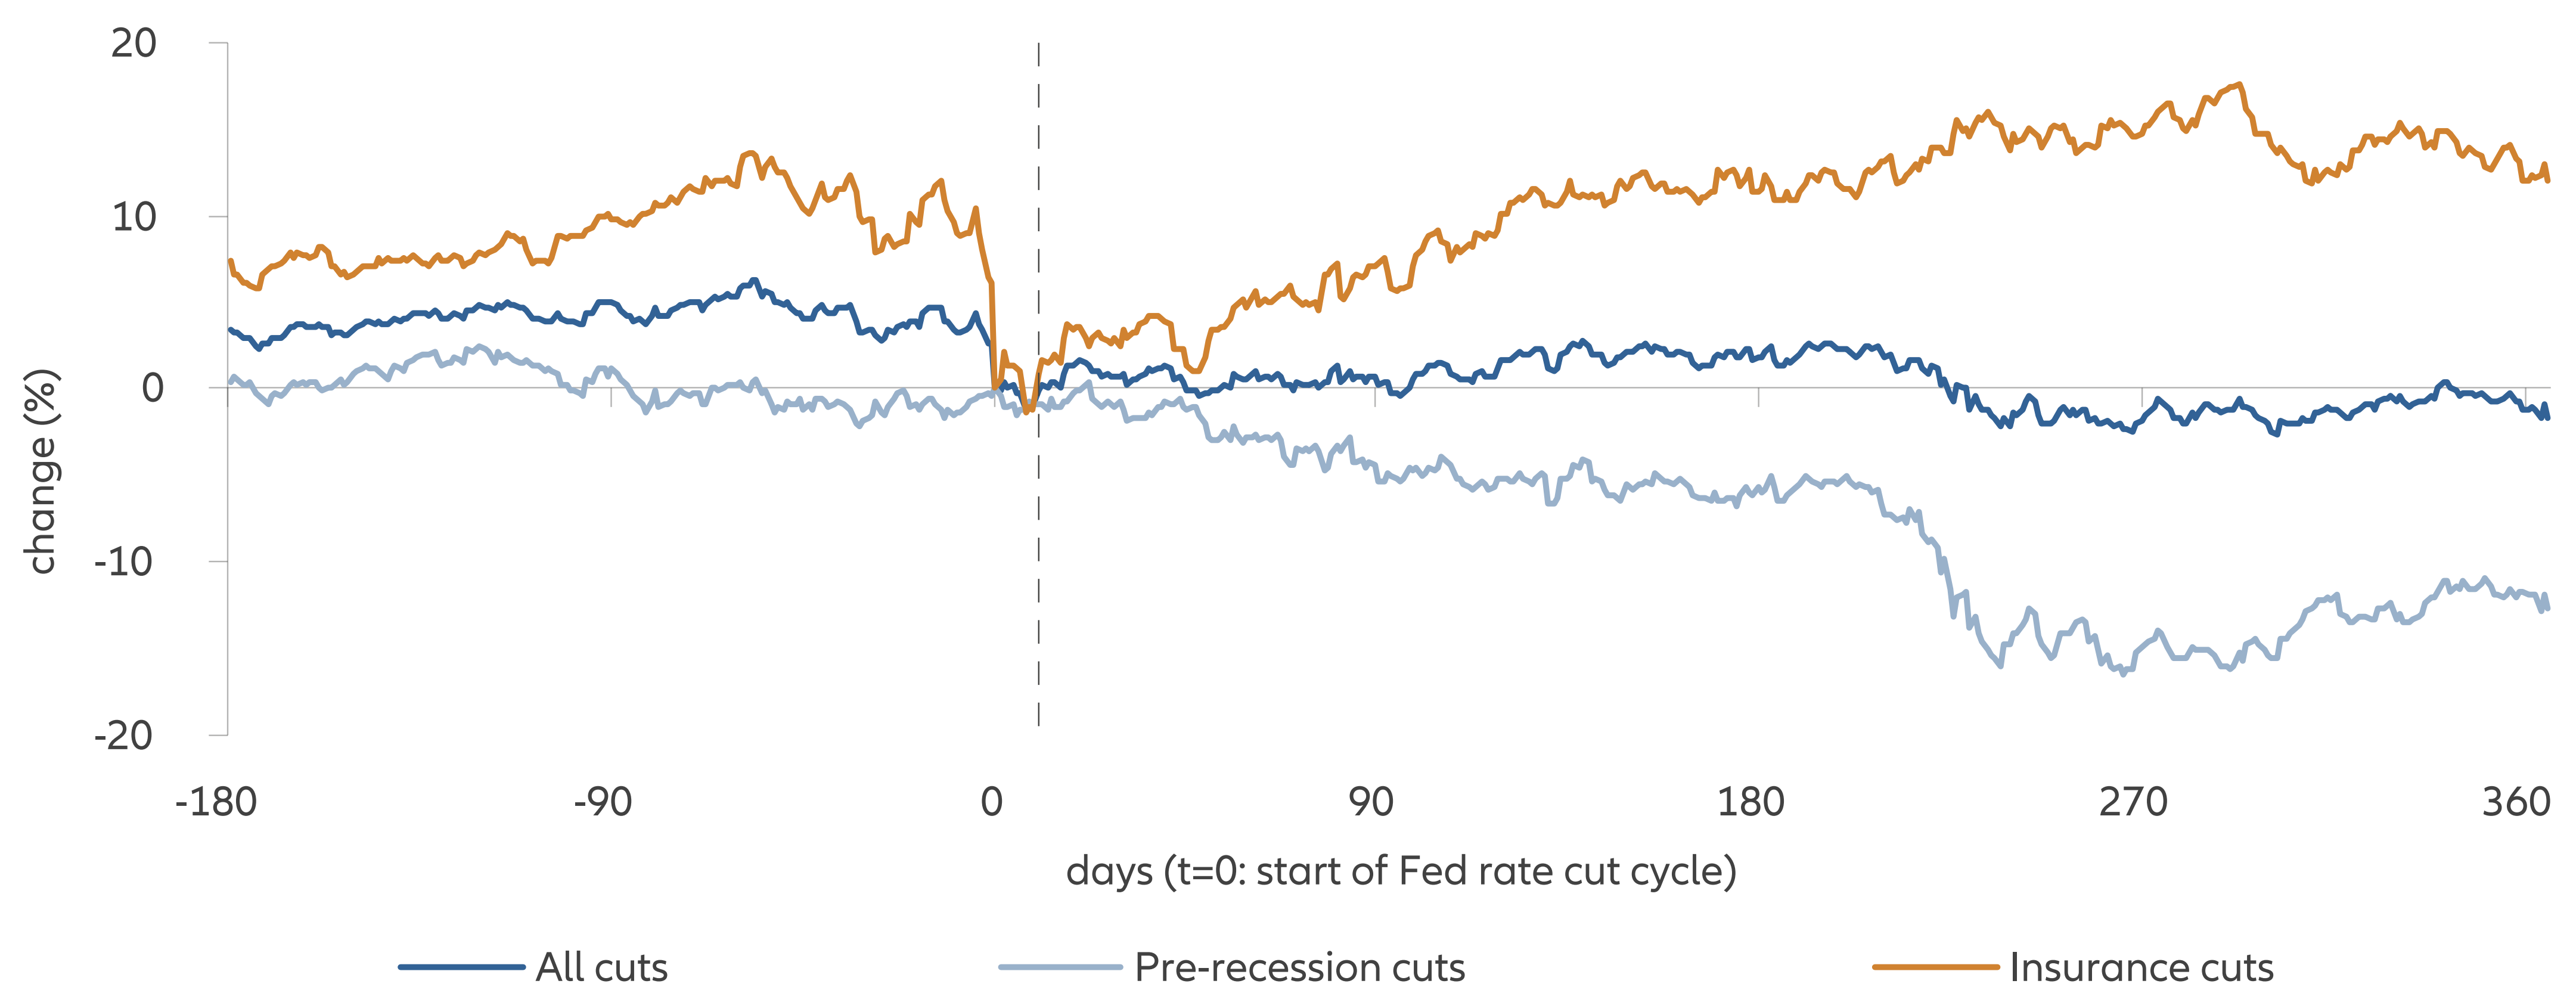
Average excess returns of US equities were roughly flat during the initial few months after the Fed started lowering rates. But overall performance across the cycle largely hinged on the Fed’s success at preventing a recession (see Exhibit 2).
- Stocks did much better when the Fed cut interest rates and growth stayed positive: During insurance cutting cycles, equities delivered positive returns across the board. But equities fell into the red on the occasions when the Fed was unsuccessful in lowering rates – and the economy sank into recession.
- Equity markets outside the US similarly diverged: Performance within both global developed and emerging markets was similarly split between pre-recession and insurance cutting cycles. Across all episodes, developed market equities did slightly worse than their US counterparts. Emerging market equities mostly beat US stocks.
- Style bias in US stocks: On average, growth stocks – those expected to grow significantly more than the overall market – did better than value stocks – those that trade below levels associated with their underlying fundamentals. And large caps delivered better returns than small caps.
Exhibit 2: Equity performance during rate cuts depended on whether the economy slipped into recession
S&P 500 excess return vs cash

Source: Allianz Global Investors Global Economics & Strategy, Bloomberg (data as at February 2024)
Currencies and commodities: a mixed bag
Changes in the US dollar depended on whether other central banks – not just the Fed – lowered rates. The dollar typically fell against other currencies when it was only the Fed cutting. In contrast, the dollar rose when both the Fed and other central banks lowered rates. In the latter scenario, perceived "safe haven" currencies like the Japanese yen and Swiss franc also tended to do well, as a broad-based lowering of rates often occurred during economic downturns or when financial stability risks emerged, triggering greater risk aversion.
Commodities were generally sluggish in times of lower rates. The asset class delivered negative results in seven of the nine cycles. On average, gold recorded moderate losses.
Prepare for possible volatility
Investors may also need to prepare for a bumpy ride in the run-up to lower rates. We found that implied volatility in US equity and bond markets tended to rise during the 60 to 90 days ahead of the first Fed cut in the last five cycles.
One way volatility could arise is if near-term market sentiment dips from a further repricing of monetary policy towards less or later rate cuts. Current market pricing anticipates roughly 100 basis points in rate reductions over the next 12 months, slightly above the historical average expectations on the eve of past cutting cycles and the decrease projected for 2024 in the latest Federal Open Market Committee “dot plot” from March. Our analysis found that the Fed eventually lowered rates by more than markets initially expected in all, but one rate cut cycle since 1989. On average, the policy rate (the Fed funds target rate) fell by 435 basis points (see Exhibit 3).
Exhibit 3: Past Fed cutting cycles tended to deliver significant rate reductions and lasted over a year

Note: The length of a cycle is measured from the day of the first to the day of the last rate cut. As the analysis focus on orthodox monetary policy easing, it excludes the post-2008 quantitative easing episodes. Source: Allianz Global Investors Global Economics & Strategy, Bloomberg (data as at February 2024)
Flexibility is key in the face of rate cuts
So, what should investors take away from our analysis? Risk assets, particularly equity markets, may still have room to perform in the months ahead if the Fed successfully engineers a soft landing – a lowering in rates and inflation without a recession. But any failure – be it recession, renewed inflation or more rate rises – could stymy stocks, which have extended last year's gains.
US Treasury performance will be closely tied to the timing and extent of Fed cuts (whether they lag, meet, or exceed market expectations) and the prevailing trend in inflation.
Overall, our analysis highlights the value of a flexible approach to the main asset classes in the months ahead as markets prepare for the first Fed cut in more than four years – a move that could herald a new investment regime.


