Navigating Rates
Breaking the barbell: a return to more active diversification?

A 15-year bull market has pushed US equity allocations to record highs, leading to widespread use of the “barbell” portfolio. This involves a heavy weighting to US stocks balanced by a big allocation to cash – with little in between. But with growing concerns about US equity valuations, normalising interest rates and the return of negative stock/bond correlation, is the barbell due a rethink?
Key takeaways
- US equities have propelled US financial wealth and equity allocations to all-time highs. While we expect a more modest continuation of this trend, we highlight the need for active diversification.
- Assets in US money market funds exceeded USD 7 trillion in November 20241 – a record – while bond allocations have shrunk to all-time lows.
- Our long-run analysis suggests that diversification into international assets, gold and commodities may increase risk-adjusted performance at times of decelerating US growth or accelerating US inflation.
The S&P 500 delivered a towering performance of +759% between the start of 2009 and October 2024, dwarfing the returns of other major asset classes (only Indian equities ran the US equity market close). In the same period, US bonds – measured by the Bloomberg US Aggregate Index – returned a mere 51%.
Over the past 10 years, US equities beat US 30-year bonds in almost every single year – a track record that, combined with sentiment and human biases, has shaped a widespread and growing presumption of a “natural state” of US equity outperformance.
No wonder that many portfolios are highly weighted towards equities, either due to price appreciation or active inflows into equities (whether via direct or indirect holdings). US households hold record-high equity portions in their financial wealth mix (see below).
In our early 2022 article on Portfolio Risk Mitigation without Bonds2, we argued for a cautious stance on bonds, showcasing alternatives such as cash, gold or actively managed strategies. Since then, times have changed completely: equity valuations are at record highs, bond yields are back to more normal levels and the correlation between equities and bonds is negative. We think now is the time to review other diversification strategies – including those that involve a larger share of fixed income.
Once an equity bull market ends, bonds tend to outperform
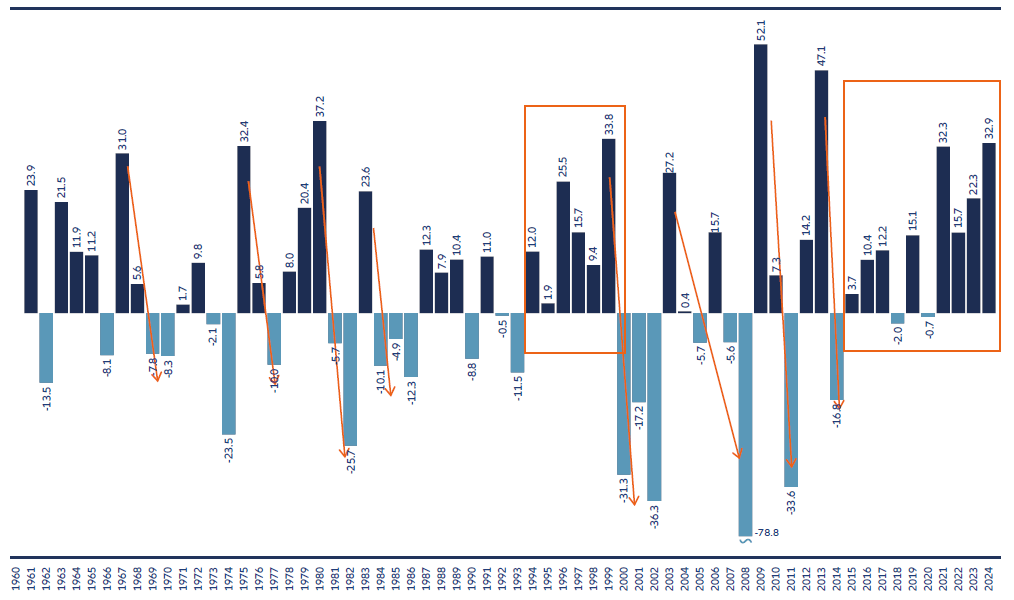
Given recent performance, there may be readers who anticipate further dominance by US equities. Allow us a word of caution. Such a long streak of equity outperformance versus bonds is unprecedented in the past 65 years. The only period that comes close was the dot-com bubble in the late 1990s, marked in the chart below, which was followed by a substantial three-year correction (see Exhibit 1). More often than not, “mean reversion” has dominated, whereby asset prices ultimately return to their long-term average – ie, after the end of an equity bull market, bonds have outperformed equities. Therefore, statistically speaking – ignoring the policy environment – we should not discount the possibility of a correction.
Exhibit 1: When it paid to have a high US equity and low bond allocation – and when it did not*

*Chart displays annual returns of the S&P 500 minus US 30-year bonds.
Source: Allianz Global Investors’ calculations. Data from Global Financial Data.
Short on time? Download the cheat sheet.
As the old saying goes, “nothing breeds success like success”. Indeed, sustained outperformance of the US equity market has acted as a magnet to investment flows, not least from US households. The result has been increased migration towards the barbell portfolio, as most portfolio risk is invested in US equities. On the other end of the barbell are cash or short-term bonds.
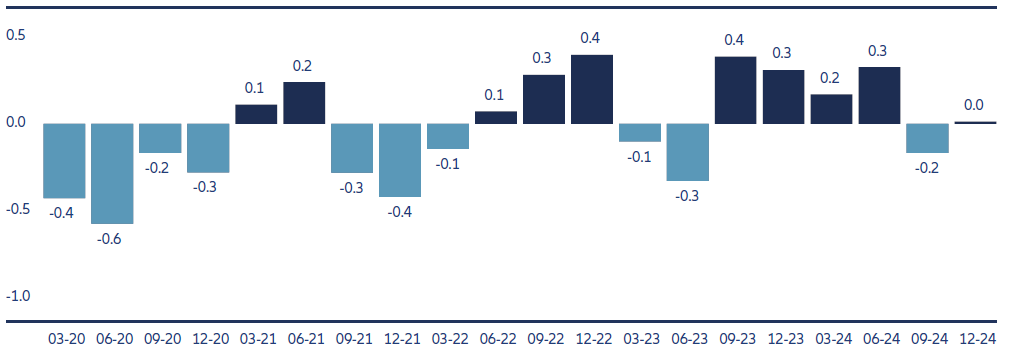
For developed market investors outside the US, the performance of US dollar cash against other unhedged currency positions has also delivered attractive returns, likely strengthening migration into their own form of a barbell. Another noteworthy pattern is the correlation of stocks to bonds, which has recently turned negative again for most of the second half of 2024 (see Exhibit 2). This kind of negative correlation implies bonds are back as a useful diversifier in stock-heavy portfolios.
Exhibit 2: Diversification is back, as stock-bond correlation returns to normal

Source: Allianz Global Investors’ calculations. Data from Bloomberg. Correlation computed for each quarter using the respective quarter’s daily returns of S&P 500 and Bloomberg US Treasury Index.
Peak household wealth and peak equity allocation
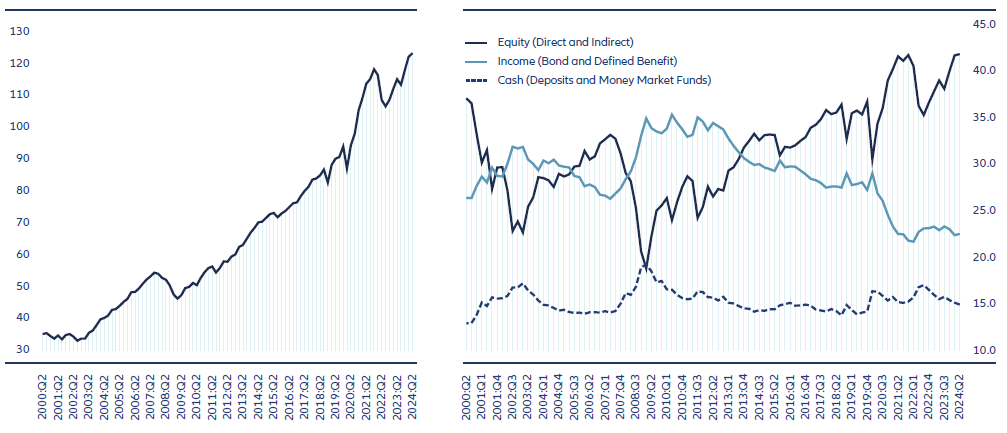
The seemingly endless run of US equities from one high to the next has propelled US household wealth to a record USD 123 trillion (see Exhibit 3). Within this, it is notable that the total equity allocation has grown to an all-time high of 42% of financial assets. We suspect it is mainly market appreciation that has moved the stock portion to this level, combined with a deliberate decision not to rebalance the allocation to more average levels. Regardless, historically high financial wealth and high US equity allocations leave household portfolios vulnerable to equity market corrections.
Exhibit 3: US household wealth at all-time high with record equity allocation

Source: US Federal Reserve Flow of Funds
In terms of diversification and risk buffers, households hold some amount of cash and bonds. As noted earlier, the run-up in money market funds to USD 7 trillion has made the news. It is often cited as an argument by the bulls, who say it represents money on the sidelines that can sustain the rally in risky assets.
However, money market funds are not the only cash-type asset. Once vanilla bank deposits and term deposits are included, we achieve a better measure of total household liquid savings – in macro terms, “precautionary savings”. This more comprehensive metric shows that the total cash allocation has stalled at about USD 18 trillion since the end of 2021 (as per US Federal Reserve Flow of Funds data). Rather than building up investable cash, households moved deposits to money market funds as a response to the Federal Reserve’s increase in interest rates, likely because money market funds simply offered higher interest rates than many banks.
Even more interesting is the cash level relative to total financial wealth. At around 15%, households’ cash allocation is quite low compared with the historic average (see Exhibit 3). On this basis, households are already heavily invested. Notably, we find that the household bond or “income” allocation (including defined benefit pension plans) has been shrinking from a level of 35% in 2012 to a level of around 22% today – the lowest in two decades. While a low exposure to bonds was arguably the right allocation in recent years, we argue there is now a case to rethink these heavy allocations to equities and cash. In other words, it may be time to break the barbell.
The long-term case for breaking the barbell
Everyone knows that putting all your eggs in one basket is risky. So, under what conditions should we expect the US equity/US cash barbell portfolio to continue its winning streak? And in what circumstances would a more diversified portfolio outperform? Using historic annual returns since 1970 (all data from Global Financial Database), we construct two different portfolios.
- The core portfolio is a barbell invested only on US assets, mimicking the current US household asset allocation. Based on data from the June 2024 Flow of Funds report, the allocation was 42% equity, 23% bonds, 15% cash and 20% other assets. In our barbell, we scale up the allocations to US equities, bonds and cash to equal 100%.
- To contrast this portfolio with a more diversified set of assets, we use the “20% other” from the household allocation to incorporate non-US equities, developed and emerging market fixed income, commodities and gold (weights are determined in inverse proportion to the volatility of their returns). We also replace the S&P 500 with the equal-weighted S&P 500 with the aim to improve diversification further.
To derive the macro scenarios, we sort the years in the period into four categories depending on US economic growth and inflation in that year as compared with the previous year. Growth was measured by GDP and inflation by the US consumer price index (CPI). The four categories are as follows:
- Years with GDP growth higher and inflation higher than the previous year.
- GDP growth higher / inflation lower than in the previous year.
- GDP growth lower / inflation lower than in the previous year.
- GDP growth lower / inflation higher than in the previous year.
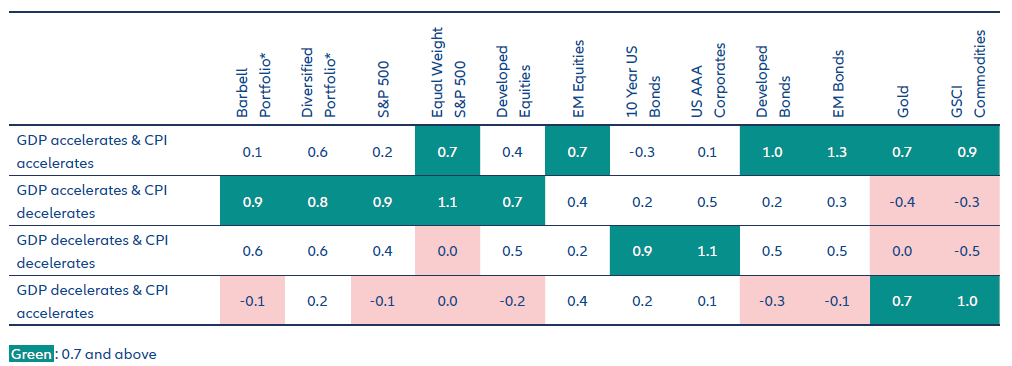
The table below summarises the results. To reflect both performance and risk, the results are shown as Sharpe ratios – the average annual excess-return above US Treasury bills divided by the volatility of returns. The first two columns show Sharpe ratios for the barbell portfolio and the diversified portfolio. The remainder show Sharpe ratios for individual assets.
Exhibit 4: Risk-adjusted return of barbell and diversified portfolios, 1971-October 2024 (asset return p.a. – cash return) / asset volatility p.a.

* The barbell portfolio allocates to US equities, cash and bonds only. The diversified portfolio replaces the S&P 500 with the equal-weighted S&P 500 and adds non-US equities, developed and emerging market fixed income, commodities and gold. See the text for additional details of the weights of the different assets in each portfolio.
Source: Allianz Global Investors’ calculations. Data from Global Financial Data
We find that the recent outperformance of the barbell portfolio is not the long-term normal case. Our diversified portfolio either matched or outperformed the barbell in terms of risk-adjusted return in three of the four scenarios.
The one scenario where the barbell outperformed was where GDP growth accelerated and inflation decelerated. The recent post-2022 inflation period provides one example of this, as central bank tightening and still-expansive US fiscal policy helped facilitate a near-perfect soft landing. Further we find that, as the barbell portfolio is largely dependent on US equities, it becomes vulnerable to the economic conditions when US equities tend to suffer. Those situations tend to be characterised by rising inflation.
Looking across the grid, the most challenging scenario was “stagflation” in which inflation rises and growth declines. Under these conditions, most assets delivered poor returns. The barbell delivered returns lower than cash. Our diversified portfolio performed better due to its exposure to gold, commodities and emerging market equities, which provided something of a hedge to inflation.3
Balancing growth and resilience
At this juncture, it is crucial to emphasise that we expect the performance of US equities to continue to be a significant driver of shareholder wealth globally, given the sheer scale of total market capitalisation and value creation. Our base case anticipates the present trend to continue as US companies make substantial investments in R&D to meet expectations and sustain valuations.
However, investors should not expect high double-digit returns to persist without volatility. Several uncertainties could lead to market fluctuations, including uncertainties about the productivity gain generated by AI technologies, the impact of Trump's MAGA (Make America Great Again) policies, and the reaction of historically high equity market valuations to increased noise, potential inflation and rising interest rates.
While it is easy to remain invested during rising markets, long-term performance analysis shows it is also essential to stay invested after market declines. To mitigate the risk of significant losses, we advocate for managing human nature (“animal spirits”), sizing risk prudently to an investor’s risk capacity, and diversifying global investment opportunities beyond stocks and bonds.
Additionally, we observe a decoupling of global economic cycles, leading to a decorrelation of market cycles, which we expect to enhance portfolio diversification.
Furthermore, a dynamic approach to asset allocation should be considered. We like those approaches that:
- Benefit from globally decorrelated market cycles
- Act as a liquidity provider when markets offer risk premiums
- Consider portfolio insurance when markets are complacent about risks.
The objective is to remain invested, but it is a delicate balance to construct a portfolio that not only capitalises on past long-term trends but also remains resilient if those trends shift.
1 Source: Bloomberg, A $7 Trillion and Growing Cash Pile Defies Wall Street Skeptics
2 Portfolio Risk Mitigation without Bonds
3 A word regarding the robustness of this long-term study. We explored different compositions of the diversified portfolio (for instance, in some, we excluded foreign fixed income altogether) including defining scenario periods according to one-year change relative to a five-year trend. Although these changes do affect the exact results, the direction of the relative performance patterns were found to be robust to the different constellations.


